== The transformation of my dumb home trainer to a smart Zwift trainer ==
Contents
Part 1: The start of a journey
Part 3: Interfacing all the things
Part 4: Give it back to me! – Remote controlling via FTMS
Part 1: The start of a journey
…to be honest – I do not remember anymore very well how it all started, but one day around June during the first big Corona wave that hit Europe last year I received a parcel from my friend Luca from Italy whom I met during various CTF events where we competed in.
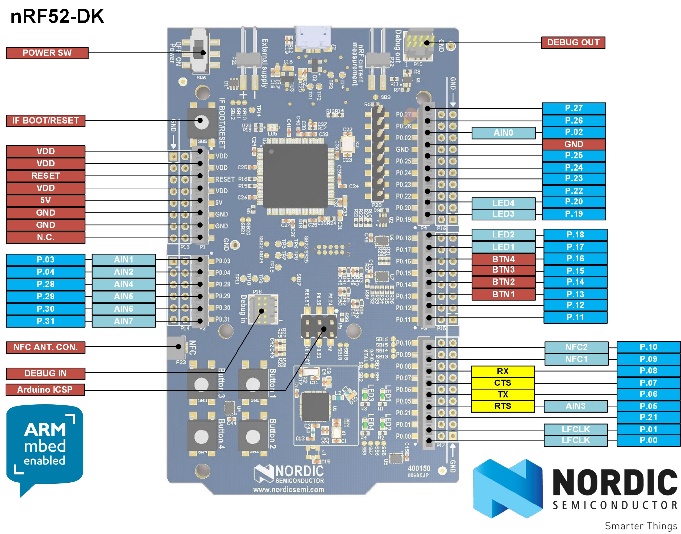
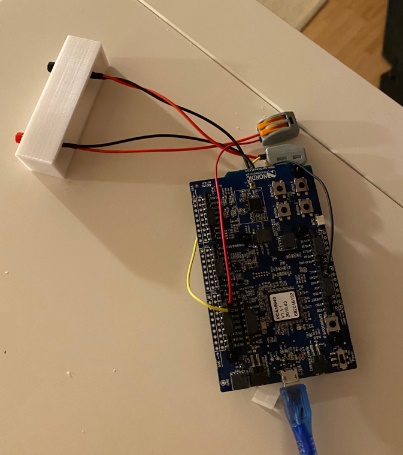
The parcel contained a microcontroller board. A nRF52 DK ( https://www.nordicsemi.com/Software-and-tools/Development-Kits/nRF52-DK) from Nordic Semiconductor which is equipped with a nRF52832 ARM Cortex M4 core. Nordic is best known for their excellent Bluetooth and ANT/ANT+ support in their chips. Luca worked with these chips some years ago during a project at work and had some spare board and challenged me to have a look at them, as he thought I could have a lot of fun with them. I am not an embedded developer though I have a couple of boards ranging from the old Atmel AVR days (memories…) before Microchip bought them off, Arduinos, Leonardos, some TI Launchpads, Raspberries and recently also some STM32 boards. All this stuff was basically waiting for me to do some great things with it. And now I had another nice dark-blue PCB with a lot of headers and that Nordic chip on it.
I had no knowledge of Bluetooth or Bluetooth Low Energy whatsoever but as most of the planned summer activities fell victim to Corona and I am indeed a sucker for cool embedded technology I was happy to have something I could devote myself to and learn a new thing or two. So instead of wasting the days during the summer months by doing nothing, I started reading the manuals and spec sheets of the Nordic board…
Over the course of the next weeks, I got acquainted with the SDK and implemented some simple Bluetooth services by following along the tutorials that were available from the Nordic site (some very well done tutorials I’d like to add!) which explained the concepts of Bluetooth advertisements, characteristics, custom services etc. You can read more about it here:
Though I have to agree with the opinion of those which say the SDK has a steep learning curve and could be less complicated at times I was pretty impressed by the quality of the code and especially of the provided demo programs which did a great job of not just showing how to write programs to implement Bluetooth but also how it‘s supposed to be done from an architectural perspective.
There is also a PC based app called “NRF Connect” which lets you scan and connect to existing Bluetooth devices or emulate one by combining and defining services and their characteristics via a nice UI. The app is available for Windows, Mac and Linux thanks to being developed with the Electron framework. There’s also a version for iOS and Android though that one is to be used a little bit differently and due to the iOS Bluetooth foundation, not all features can be used the same way as on Windows for example. NRF Connect shows its real power when you have another Nordic device, like for example a nRF52840 Dongle (https://www.nordicsemi.com/Software-and-tools/Development-Kits/nRF52840-Dongle), that you can use as a client (or server!) and connect to your app, that runs on the DK. Due to the interactivity of the tool you can for example address individual parts/services of your app and send commands/data in order to trigger some behavior or just use the app as a client. Since the iOS variant was not without problems this tool proved to be very valuable and helpful!
As I said, I had little knowledge about how Bluetooth actually works apart from that my heart rate sensor for fitness activities used Bluetooth Low Energy and my ear pods for hearing music but what I learnt was that it was actually not magic what was happening there, and one could basically write cool applications using Bluetooth.

After these first successful baby steps with that new platform, it was then that I remembered that I had plans to replace my old cheesy home trainer bike I bought at a local discounter some years ago with a cool “trainer” which everyone seems to be using now that Corona forced many of us to stay indoors.
I used to do one-hour rides daily on this home trainer while watching TV with the family but having done that for some time it actually started to become quite dull just pedaling away without much “feedback”. The home trainer could restrain my attempts with up to 400W over 32 difficulty levels (however I almost never went past level 10), had various exercise programs (that, granted, I never actually used…) and the various standard features like display of cadence, km/h, burned calories, distance, etc.
So, I was on the lookout for one of these smart trainers that you could connect your bike to the virtual words of Zwift, Tacx, The Sufferfest, Kinomap and various other apps. Those apps combine the fitness training with gamification: In Zwift, for example, you can compete online live against other riders in those virtual worlds, do workouts or just ride for your enjoyment through the cities of London, Paris, New York or Innsbruck. That was indeed promising much more fun, diversion and motivation than just pedaling away on my own in our top floor sleeping room while watching some TV series.
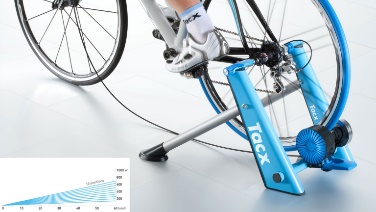
Though those hardware devices are definitely no cheap invest and you will need to have an accompanying (racing) bike it turned out it was easier said than done as all these kind of products had been sold out and were on back order for MONTHS. So even if I had a racing bike (which I did not) and I was ready to spend a lot of money on them (which I considered), I would not have had any luck in getting my hands on any of those. It was not only the top range of products with integrated magnet brakes and all kind of technical finesse but also the cheap variant where you just have a roll pressed against your tire to simulate the resistance that were ridiculously hard to get.
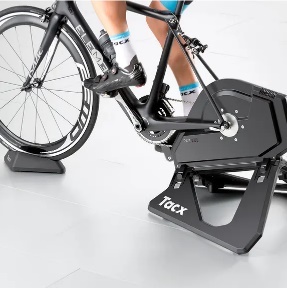
It was not until Christmas until the situation improved and stores were restocked slowly. These smart trainers are connected via Bluetooth or ANT+ with the smartphone apps and using those apps you can then control the devices by setting the difficulty level, simulating various terrain you are riding on, incline, set a target power to achieve and keep and so on and so forth. Of course, also those apps come for a price and you must have a subscription to use them. In return you get a rich eco system with their own community, virtual riding clubs and lots of events and virtual landscapes you can ride in. How about riding the Tour de France from your home? Just how cool would it be to mimic such a smart trainer to be able to use those apps for my rides, I thought? Well of course such an elaborate device was not to be simulated but all I had was my cheesy home trainer. Well, it is not that my home trainer was THAT bad. It HAD all those nifty readings like cadence, speed, total miles traveled, burned calories and so on and so forth. It just had no means of actually exposing them to the outside and just displayed them on the cheap mounted LCD display. The trainer was about 5 years old and back then nobody seemed to care about those features unless you were cycling on a professional basis.

But also for those not equipped with the latest and greatest in sports technology, the vendors of those apps have something to offer to enable you to use (i.e. pay for) their services. You can attach a cadence and speed sensor to your bike (actually two sensors: one to the pedal crank and one to the wheel hub) so you can at least deliver those basic parameters to the app so they can see how fast you go. “Real” smart trainers deliver this and much more like the wattage/power you deliver while riding, the relation between the forces on the left and right side of the pedal, average measurements, etc. etc. So, I thought “Well, let’s go for the very basic setup at least then!”
There was only one problem (well actually there were a few, but one stood out). My home trainer had no actual wheels, just an internal rotation disc that was slowed down by magnets to create the desired resistance for the rider.
So while I had a crank to fix a cadence sensor to, I had no place where to put an actual speed sensor and unfortunately it was primarily the speed sensor that those apps want to have data from and cadence data was just “nice to have”. So I couldn’t even fulfill the most basic requirements to use those apps. Bummer… So, what to do?
It was then that I learnt that according to the Bluetooth Low Energy (BLE) standard your application could be both – a server (“peripheral”) and a client (“central”) at the same time.
And – guess what – the Nordic SDK also had an example for that use case. It demoed connecting to a device offering the heart rate sensor service (HRS) aka “a heart rate sensor” as well as a device that offers a running speed and cadence sensor service (RSCS) aka “a running sensor” and providing a unified view to a 3rd party app. This is something to build on, isn’t it? For the most basic setup I would need to provide the “Cycling speed and Cadence” in a device that Zwift connects to and Zwift would then continuously read the speed and cadence readings from it and use it in its in-game representation of your virtual rider.
I spent the next week adapting the example to my needs. As it turned out, while the SDK had an implementation of the actual RSCS client service, there was none for that cycling speed and cadence service (CSCS). Thankfully, all those services have been standardized by the Bluetooth Special Interest Group (“Bluetooth SIG”) in order to ensure the products of various vendors are compatible between each other. All those specifications are available online and describe in more or less detail how the service is to be build and exposed to a client, which features it must or should offer and how it should react to commands the client sends to it. There are not only specifications for a heart rate sensor and a cycling sensor but there is a horn of plenty of services. You can see a list here: https://www.bluetooth.com/specifications/gatt/ . The CSCS is described in this document, https://www.bluetooth.org/docman/handlers/downloaddoc.ashx?doc_id=261450 and the Cycling Speed and Cadence Profile is described here https://www.bluetooth.org/docman/handlers/downloaddoc.ashx?doc_id=261449. So what is the Profile then you ask? The Bluetooth profile for CSC for examples mentions that the CSCS should always be offered in combination with a BAS, the “Battery service” in order to let the client see the remaining battery level of his sensor or the “DIS” the “Device Information service” that provides information about the HW or SW version of the device, the manufacturer and a serial number. All this is specified in great details and you basically “just” have to implement it.
After some days and lots of reading I was able to transform the client part of the aforementioned RSCS into a CSCS and guess what – it worked! My “proxy” was properly detected by my smartphone (or the NRF Connect app) and delivered the CSCS data from my sensor to the app! Awesome!
But – this did not solve my underlying problem yet that I only had cadence data and with cadence data and no speed data – no joy!
After some tests I also realized another problem: I didn’t want to spend too much money on the cadence sensor until I was sure that what I was aiming for was actually achievable, so I opted for a cheap cadence sensor from eBay and not for a renowned product from one of the big fitness equipment companies.
And as usual, it turned out, it was money saved on the wrong end: The sensor seemed to be actually quite buggy: Not only that the bonding information (i.e. the link between the Bluetooth peripheral and the central) was lost over and over again without apparent reason; the actual measurements were totally crazy. One second I was pedaling at around 80 rpm, the next second it was 120, 90, 70, 30, 80 again. I replaced the batteries, looked for firmware updates and resetted the device, but all to no avail. Thinking about the potential causes of the problem I assumed it might have to do with the magnetic field the home trainer was inducing due to the magnet brake which might influence the sensor – or maybe even only the Bluetooth communication? I wasn’t sure about that but I noticed that all the reviews I found in the Internet about those sensors were all talking about real bikes where the sensor is attached to. Well, no wonder. On an indoor-bike, you HAVE those readings as well from that bike computer already built-in, just like I had it too, so why would anyone add another sensor that delivers no new information?
Thankfully, I decided to give the product of a well-known vendor (for the three-fold price…) another chance. If I would see the same result there, I could return it but I was hoping for the good and that it worked. And it did! Flawless and perfectly stable readings perfectly in tune with what I saw on my bike computer!
I felt a big rock falling from my heart because that meant I could continue my project in high hopes.
Funnily enough while investigating the services of the cheapo sensor, I noticed that it seemed to be built around a Nordic nRF chip too, well at least some Nordic specific Bluetooth services were exposed like OTA (“Over the air”) firmware update and so on. Well, even on good hardware – if the software you write is *** you have no joy… By the way, also the professional smart trainer products seem to be using the Nordic chips, at least one famous brand, as I later found out.
I realized my project would not just involve coding, but also solving some much more basic problem: I had no place on that home trainer where to actually put the nRF52 DK nor the iPad when the Zwift app was running! Sure, I could connect the iPad via Airplay to my TV but I’d rather like to have it attached to the bike. I browsed Amazon for some tablet holder, but it turned out that none of those were really well suited for my particular model and it’s outline of the bike computer on top.
Neither was I lucky in getting any information about the OEM of that home trainer. After multiple days of chasing support mailbox after support mailbox I learnt that the OEM had gone bankrupt in the meantime since I had bought it back then and neither was there a retro-fit for a tablet holder for that model nor some schematics or anything that might come in handy later-on. So, I had to put my trusted 3D printer to work again and do it myself! On thingiverse.com I found a model for an in-car tablet holder (https://www.thingiverse.com/thing:2963853) that was meant to be fixed to the back of the driver’s seat for the passengers in the fond and I worked from there to customize it a little bit for the measurements I had.
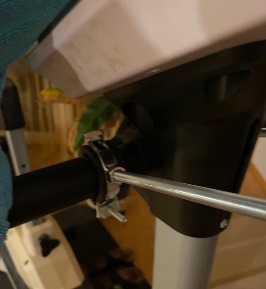
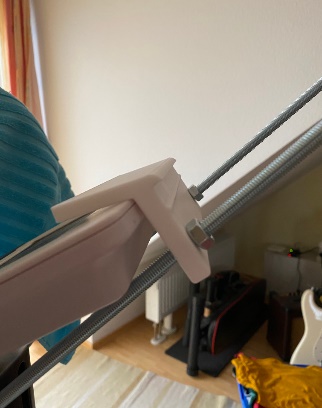
Luckily, the original designer I got in contact with agreed to help me with my endeavor and so I got multiple designs from which I could choose the best fitting that I then printed. My main concern was that the overall structure was too heavy so the iPad might not be put there safely. I bought some M8 metal rods on eBay and some clamps that I fixed to my handlebar. The tablet holder could be threaded onto the rod and one lid was resting over the top of the bike computer and secured with some nuts from getting loose. Using that approach I suddenly had a very stable construction that I could trust to hold my dear iPad and keep it from falling and shattering on the ground. As usual during those trial and error approach, I realized again I need much more in addition like non-locking M8 nuts and all those kind of things, so it took some days until everything arrived but eventually everything was like I intended it to be (for the moment)!
Anyway, back to the problem at hand!
My home trainer’s computer did show speed data and also Watts next to cadence, so it was able to measure it somehow – or, at least – derive these measurements based on existing measurements.
I started some experiments and wrote down the readings when going at a certain speed and found out that the displayed speed on my trainer was the result of a linear function based on the cadence.
Actually:
average cadence (rpm) x 2.58 x circumference of wheel (m) x 3.6 = average speed (km/h)
The 2.58 is the factor I found by comparing all the measurements, meaning for every crank revolution there had to be 2.58 wheel revolutions when relating and comparing the cadence values with the speed values of the bike computer. 3.6 is of course the factor to get from m/s to km/h.
For the circumference of the wheel I used 2.136 m based on the following assumptions: rim: 27”, tire: 25 mm rim: 630.00 mm + 2x 25.00 mm = 680.00 mm (diameter) x π = 2136.28 mm (https://www.bikecalc.com/wheel_size_math)
I verified my measurements over various value ranges, while pedaling at 60,65, 70, … up to 100 rpm and it matched perfectly! That means I could now just calculate my current speed based on the cadence readings I got from the sensor! I didn’t know if it was actually correct but at least it was what the bike computer showed me as well, and based on my “real life” muscle memory I’d say the speed it showed to me was very plausible.
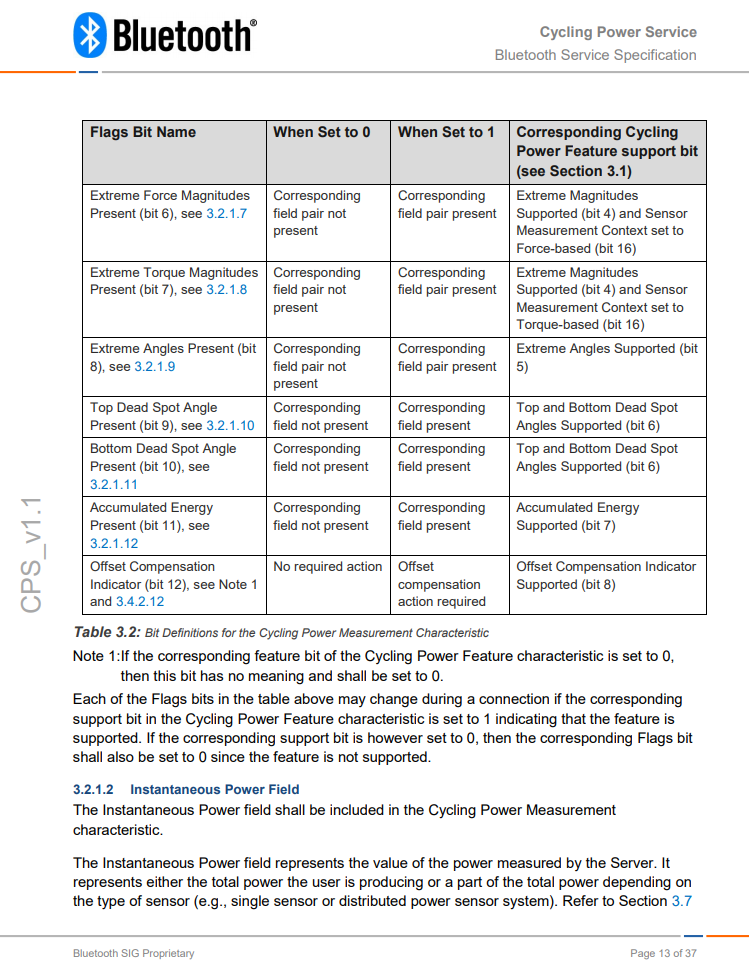
One challenge was, that neither the cadence sensor nor my “fake” CSCS sensor actually delivered “the” speed or “the” cadence in raw form. Instead, the sensor sends its current readings in a more or less one second interval to its central (receiver) according to the specification (https://www.bluetooth.org/docman/handlers/downloaddoc.ashx?doc_id=261450, passage 3.1.1.2):
3.1.1.2 Cumulative Wheel Revolutions and Last Wheel Event Time Fields
The Cumulative Wheel Revolutions value and the Last Wheel Event Time value allow the Client to calculate the speed (instantaneous and average) as well as the distance travelled. This calculation requires the Client to know the wheel circumference of the wheel where the measurement is taken.
If the Wheel Revolution Data Present bit is set to 1 (bit 0 of the Flags field), then the Cumulative Wheel Revolutions field and the Last Wheel Event Time field shall be present in the CSC Measurement characteristic. Otherwise, both fields shall not be present and bit 0 of the Flags field shall be set to 0. The Cumulative Wheel Revolutions value, which represents the number of times a wheel rotates, is used in combination with the Last Wheel Event Time and the wheel circumference stored on the Client to determine 1) the speed of the bicycle and 2) the distance traveled.
In addition, if there is link loss, the Cumulative Wheel Revolutions value can be used to calculate the average speed of the bicycle during the link loss. This value is expected to be set to 0 (or another desired value in case of e.g. a sensor upgrade) at initial installation on a bicycle as described in Section 3.4.2.1. The Cumulative Wheel Revolutions value may decrement for some implementations (e.g. If the bicycle is rolled in reverse), but shall not decrease below 0. The ‘wheel event time’ is a free-running-count of 1/1024 second units and it represents the time when the wheel revolution was detected by the wheel rotation sensor. Since several wheel events can occur between transmissions, only the Last Wheel Event Time value is transmitted. This value is used in combination with the Cumulative Wheel Revolutions value to enable the Client to calculate speed and distance. Since Cumulative Wheel Revolutions value is a UINT32, the highest value that can be represented is 4,294,967,296 revolutions. Assuming a wheel circumference of 2.1 meters, the maximum distance that can be represented is 9,019,431 kilometers. Since the product life expectancy of CSC Sensor is about 5 years and given that top level cyclists may reach 15,000 kilometer a year (75,000 km in 5 years), this value significantly exceeds the expectation. This value is not permitted to roll over. If a reset or other specific setting of the Cumulative Wheel Revolutions value is required, see Section 3.4.2.1 for requirements related to setting the value of this field. The Last Wheel Event Time value rolls over every 64 seconds.
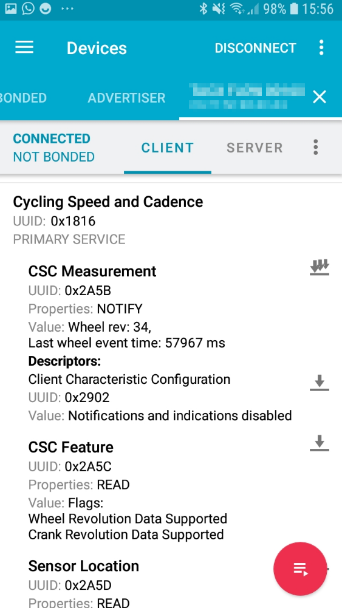
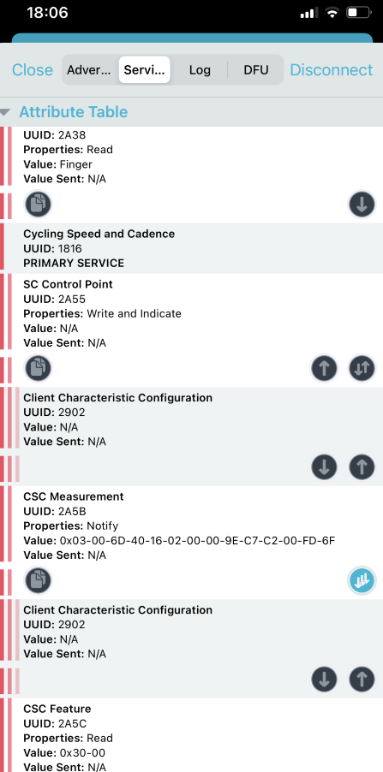
Nice, huh? Well, actually, it is not that hard to understand and as I already mentioned the provided examples in the SDK are very helpful here, because there is the CSCS peripheral service available, i.e., a simulated CSCS sensor. By using the NRF Connect app with the debugger of your IDE (the nRF52 DK has an embedded SEGGER J-Link and Nordic provides you a free license of Segger Embedded Studio for private non-commercial use!) and some concentration, you quickly understand how that spec was turned into code and is encoded and transmitted. The screenshot shows the information a friend of mine who owned such a real smart trainer saw in the nRF Connect app. By using those tools and reading and comparing values from real devices I step by step “reverse engineered” what I had to do and how to do it.
Based on my observations I thought: “OK, based on my last cadence reading I know one revolution happened in X/1024th seconds. Given that the relation between crank revolution and wheel revolution is 2.58 as I found out empirically, I will have achieved 2.58 wheel revolutions during the same time. However, I can only send integer values via the characteristic, so I now need to calculate when I had achieved exactly 2.0 wheel revolutions and what fraction of those X/1024th seconds that happened and deliver those measurements”.
I do not know if that sounds simple, but I can assure you, it was not. At least not for me. Not being a proficient C programmer, I not only had to implement all this from an algorithm standpoint, but learn a fair share of C as well at the same time. I “learnt” C many years ago, but these days mainly use C#, Python or other languages. So, implementing all that also meant I had to sit down and learn some basics: casting, memory representation of values and – of course – pointers and pointer arithmetic (Yuck!). However, it was fun, really! I learnt so much during those weeks. Of course, I was sometimes sitting on a simple problem for hours, but when I finally had the solution how to do it, it was extremely rewarding and I surely had learnt it then, because during the debugging I understood why it had to be the way it had to be.
Again, I have to say, the very clean and concise examples in the SDK were very helpful here. Confusing at first, when you sit down and take your time to actually read through the code and try to understand why it’s done the way it’s done, the whole things suddenly “opens up” and starts to make sense. Throughout the whole development I often visited the nRF community https://devzone.nordicsemi.com/ where you can ask questions to the community but usually receive answers from the tech staff at Nordic within a day, explaining to you in a comprehensible way a solution to your problem. I took advantage of that quite some time over the course of this project :-D
So, I finally extended my embedded app accordingly and after a short while “speed” data was available to the client application as well. That means I reached my first big milestone!
From that moment on I was able to do an actual virtual ride on Zwift because:
1) Zwift detected the nRF52 DK as a device offering the CSCS
2) Zwift received the cadence and speed data through that service
Yeah! Party mode on! I was extremely excited because it meant I had achieved something which to be honest I would not have assumed I could do “so easily” (*cough*).
Granted, I should write immediately here as well, that this was the very first implementation and it turned out it was buggy as hell because I could not handle edge cases when the delta time between two readings turned out to be extremely small and resulted in ridiculous/unrealistic high speed ratings due to the way I calculated it and many more things. So, I definitely revisited that code A LOT over the next couple of weeks and it gave me severe headache to make that code as resilient, clean and proper as possible.

Though… despite all those good feelings… in the end, it was of course not that much – all I was able was to send speed and cadence and I had a virtual rider in the game that rode along with me. While the cadence was straight to the point, the in-game speed however was way off. Using the power of Google I found out that the actual speed in the game is calculated by Zwift itself, because it was also “guessing” the power you generated for obtaining that speed you sent. In Zwift (and probably all those other apps), it’s all about the power that you’re delivering. It’s the most reliable and concise measurement of how much work you deliver in your workout or virtual race. So, for those very basic trainers, where you only had a roll that your bike wheel was pressed against and that induced some resistance for you, the accuracy of what you do vs. what you see in the game was actually more or less some estimation according to what I read.
Of course, the game also features inclines and descents, nice scenic mountain tracks and so on! But I had no way of feeding this into my application: I was just cycling away like I did all those months on my home trainer before at a certain resistance I set and a certain speed that I was used to, delivering more or less the same Wattage throughout the whole training.
So, to a certain extent that meant I would be biking up a steep hill at a decent speed where my competitors were sweating away and fighting for every single wheel revolution.
There must be more to it. I had to rethink my approach!
Part 2: I’ve got the power
Before we go into further details of the project, there’s something I’d like to state here up-front:
Some of you might think: “Yeah, nice… and now he just needs to tweak on one variable and is then able to send 200% the actual power he generates to the game, making him the winner in every race.”
I think you certainly have a point here. This is totally possible and indeed very easy as well given the level of control you have. Honestly, I don’t even know if there are such cheating devices available that ride for you at high speed and let you win high scores and trophies. Well, yeah, probably there are those.
But that’s not my point. I would not have spent all the time to create an accurate model and simulate all this to that extent if it was about cheating. I could have had that much easier. No, on the one side it was a challenge for myself to see if I am able to write such a program that helps me make my „dumb“ smart trainer „smart“ and let me enjoy Zwift the same – or nearly the same – way as someone who was willing to pay 1400 bucks for a smart trainer. Not to forget all that on a new ARM-based microcontroller platform, a first for me where I had zero experience until then. And the other main reason was that I wanted to have such a device to have a motivation to keep myself fit during these days of the pandemic. And there is one thing I can assure you: Doing the training sessions and predesigned rides in the app is no walk in the park. Actually, it was much more physically demanding than I would have expected it to be. It’s not about winning races for me. Actually I wouldn‘t even mind if I cross the finish lines as the last one (which thankfully I am not), but it’s about challenging yourself with longer tracks, more incline, more Watts/kg and a higher cadence every other day. And I have a paid subscription to Zwift to do this of course.
That’s the point.
Enough of that topic now, back to where we left the last time. So, I have CSC data available and I can virtually ride along the tracks on my home trainer which is very “disconnected” so to say:
“Simulating” the track meant I would need to press the + and – buttons on my trainer whenever I saw that my virtual rider was about to climb a hill to make it harder for me in real life too. A poor man’s smart trainer so to say. Also, we already say that the in-game speed was totally different at times from what I saw on my bike computer. But as we already know, my trainer does not have any means of outputting any of the training data it showed on the LCD. All I had was that cadence sensor… But… as we already found out, the speed was directly related to the cadence – maybe the Watts were as well?
I started sampling the values on the various resistance levels (32 levels in total) at various cadence. Much to my surprise I saw that it was indeed easily possible to see the relationship between the displayed wattage on the computer and the cadence.
For example, at resistance level 10, my default level, when I was cycling exactly at 80 rpm, the wattage shown was 180W, at 81 rpm it was 183W, at 79 it was 177W. It doesn’t take a genius to see that there was a linear relation to that:
Watt at resistance level 10 = 180W + (rpm – 80) x 3
It matched perfectly over the whole range of 60-90 rpm. Below and above those cadence values it became difficult as it was either hard to keep a steady frequency in order to see stable values (cadence and km/h were shown in an alternating way every other second) or it was much too easy-going to come down to such a little cadence. So I cannot be 100% certain that the function is indeed linear to the input of the rpm but over a wide range it’s good enough for me.
I repeated the process for resistance levels 10-20 and ended up with similar relations. Most of the levels, it was just the case that the starting offset seemed to be higher by 10 for every level, so at level 11 we had “190W + (rpm – 80) x 3”, but around resistance level 18 or so I also noticed, the values spread out a little bit more and I concluded that the factor in the end was actually now x4 and no longer x3. As I said I verified all my assumptions with live readings from the trainer and when I was confident that my results were correct, I implemented it into the app. At that time, I thought “Well, level 20 is surely more than enough. I actually never rode on a level higher than 14 or 16”. How wrong I would be with that assumption, I did not know yet :-D
From that moment on I was able to send the produced wattage based on my received cadence readings and could basically also sent it to the game… In theory… There was just a slight problem. The CSCS did not have any means of sending this kind of detail. It was about speed and cadence and nothing else! And – this should be clear by now – you cannot just send “anything” what you think makes sense and hope for the best. The server as well as the client know very precisely what kind of readings are to be expected for a given Bluetooth service, how those are encoded and transmitted. And there is no way to send “a little bit more”.
But I am sure it won’t surprise you when I now state that also there was a Bluetooth service specified which was to be used for that purpose! It was the “Cycling Power Service” (CPS) that Bluetooth SIG had defined together with sports equipment manufacturers. And it was doing exactly that. It delivered the power the athlete generated: instantaneous, on average, the torque, the level of attack on the crank, the relationship between the left/right forces on the pedals, dead spots and more! The whole specification can be downloaded here: https://www.bluetooth.org/DocMan/handlers/DownloadDoc.ashx?doc_id=412770 and of course there is also again a “profile” coming along with the service, called the Cycling Power Profile (CPP) : https://www.bluetooth.org/DocMan/handlers/DownloadDoc.ashx?doc_id=412769
OMG! Nearly 40 pages of dry technical definitions to implement in C – at least the most important parts of it, like the transmission of the power. The problem with that was, I realized, that it was that particular unpleasant situation again, that there was zero example code available in the SDK! While the nRF SDK had actually quite a lot of examples of well-established Bluetooth services like heart rate measurement, battery service, device information, cycling speed and cadence, running speed and cadence as client and server and some more, it by far does not have implementations for them all and one service that was missing was the CPS. The situation wasn’t necessarily better in the SDKs of other silicon vendors. There too, especially those well-known services like the heart rate monitor were implemented in examples but those more exotic ones were not.
The nRF Community maybe then? I browsed the community up and down and found many posts were others were looking for exactly what I was looking for as well: examples of an CPS implementation to build upon that or reuse it. But the answers were discouraging. Either non-existent or they were discussing issues I didn’t even realize I would have to face – and again without a good outcome.
Furthermore, the provided smart phone apps from Nordic too had clients only for those prominent services but not for CPS. So, I was on my own to a) implement the server and then b) had no client code to test or verify it’s working correctly at all. Non, besides the actual Zwift client. So, I could implement the service and hope for the best and when it wasn’t working as expected I would have a happy time debugging to see what might be potentially be the cause.
Funnily enough: Weeks afterwards, while working on the FTMS Service (Fitness Machine, see later-on 😉) I realized CPS wasn’t too hard at all and there were indeed a lot of more or less complete implementations that you could find on GitHub or stackoverflow.com. Basically, the scenario repeated there for FTMS. It was next to nothing to be found for the problem at hand but suddenly I found a lot of good posts and examples for issues, I already solved in the meantime :-D That’s life…
So, it was spec reading again. Again, I have to say, in retrospect, the actual problem wasn’t too hard, just unfamiliar. When you’ve done that a couple of times, it becomes kind of “second nature” and much easier as is to be seen for FTMS. The important part is to understand the architecture and the concept that Nordic showed for instantiating and using the provided services in their SDK. Of course it might be great to have ready-made implementations of all the services provided by Nordic in the SDK but with the experience I have gained by now I’d say it’s not really necessary.
I opted for implementing the bare minimum to get it working. Among all those measurements I listed above the CPS also had the measurements for cadence and wheel revolutions, just like the CSCS. One could say, CSCS is a kind of predecessor of the CPS. Or maybe CPS is a kind of augmented CSCS. Sort of.
I started by copying the CSCS source files and changing variable names at first, then checking and extending the existing functions that would also be needed for the CPS as well. Basically, the only hard part would be the encoding of the measured data points and the provisioning of the provided features.
For integrating the service, I opted for a decoupled implementation.
Basically, what happens is:
1) The cadence sensor provides raw cadence data as a peripheral to my app on the board acting as a CSCS client
2) My code, the CSCS client component, enriches the raw cadence data with calculated wheel data and “notifies” the CSCS server component, which runs within the same app
3) The CSCS server component can be connected by the smart phone app (“Zwift”) to get notified by updates itself. That means, to Zwift it looks as if the Nordic development kit is the source of the events/data.
Now I add the CPS server to the provided and advertised services on the DK. The client (smart phone app) sees the service and can subscribe to it (i. e. ask for notifications when new measurements are available). The CSCS client component (see b) above) notifies its subscriber that new data is available. In that routine I copy over the measurements from the client to the server.
Now I just added a call to another event handler (the CPS event handler) to process this CSCS client data as well.
Once processed I add the calls to calculate the power from the cadence data which I received and add the resulting Watts numbers to the event along with the already existing data of CSCS (cadence and speed).
At that point I were not sure what the best approach was, and I opted for actually duplicating the code of the calculation of the raw cadence and speed values from the CSCS module to the CPS. The reasoning was: “Ok, maybe I want to have a pure CPS service later, without being dependent on the pre-calculations done in CSCS?”.
That approach worked pretty OK for quite some time until I dropped the idea of having totally separate implementations and refactored everything to end up in one common “model_calculations” module, but more on that later.
Back to business: Ok, the service measurements were populated, the service was added to the advertised services list, the board was flashed and… Zwift found a Cycling Power Service on my board and the shown live readings coming from my formulas were matching exactly the values I saw on my bike computer when I was riding! Awesome!!

The next round of test rides was planned! This time my power rating was directly related to the data I provided when going uphill or downhill with the resistance level I had selected on my trainer.
But – only – on that resistance level! I had no means of changing that! Of course, when I pressed the + and – buttons on the bike computer, the home trainer made it more or less difficult for me to keep the speed or cadence and also my Watts output changed accordingly, but this change of difficulty didn’t make it into my app as I still had no means of reading anything from the home trainer itself as you remember!
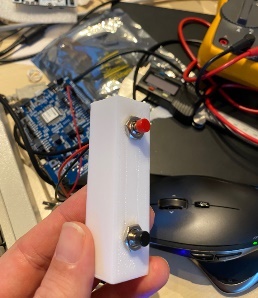
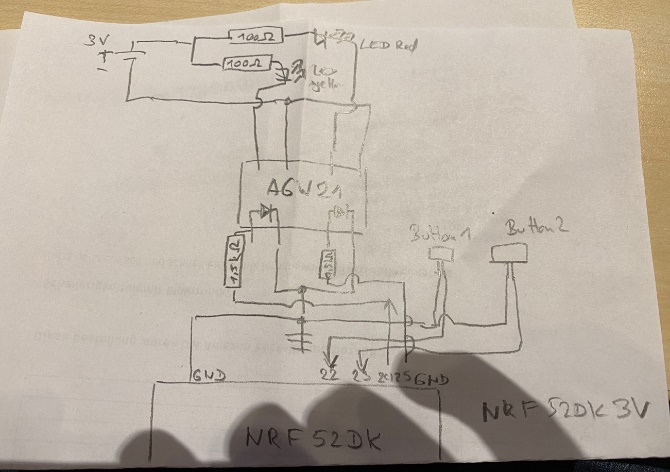
So, I came up with another idea: I needed some external inputs to be used by the app. I thought about some pushbuttons that I could use in order to signal a “difficulty +” or “difficulty –” respectively to the microcontroller. So whenever I changed the difficulty on the trainer via the buttons I would also hit that button to change it in the app as well! At first, I was looking for some quiz show buzzer like gadgets, maybe even with Bluetooth, but I could find none. After some fruitless hunt I decided to go with some simple pushbuttons which just get connected to some GPIOs of the nRF52 DK to signal when the button is pressed.
One particular annoying problem with connecting external mechanical inputs to a microcontroller is the problem of debouncing those inputs.
What does that mean? If you do not debounce the signal, what will happen when you press the button and connect it to GND (or TTL high) and look at it with an oscilloscope or a logic analyzer.
You might think that once the circuit is closed (or opened for that matter), the signal will just transition from Low to High or from High to Low. In the end, after few milli-seconds, this is indeed what will have happened. But until that state is stable, you will experience multiple transitions between those states for a very brief time until the contacts finally stay in contact. Think about the rough surface of the metallic constants on a microscopic level and what it would like to connect those. It is like mountains colliding with their peaks and summits all the time until they find a position where they can finally align next to each other. On a oscilloscope it might look like this:
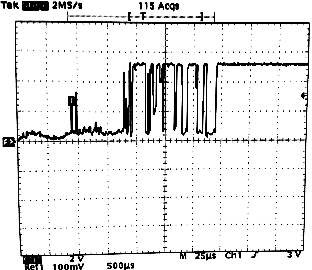
The problem is that for a human these bouncing states are not even noticeable timewise but for a microcontroller they seem to take an awfully long time. And the microcontroller will react on those changes. If you configure an interrupt routine for every transition change because you want to increase a variable, like in my case the difficulty level, you will be surprised to see that once you briefly hit that button, the result will be 3,4,5 events that the button was pressed in your app! By debouncing you basically try to stabilize this situation quickly by software or by hardware and only deliver a single “pressed” event despite multiple interrupts taking place.
The nRF52 DK already had 4 push buttons on the board itself and the manual stated that those were already equipment with some debounce filter, so one would not have to care about this problem there. The buttons on the board can be configured using the board support package code to wake the board from sleep, delete bonding information and so on. This was very important to me!
Why? Because of this:
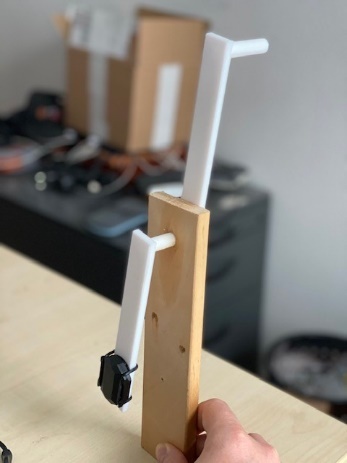
I already mentioned my cheesy cheap cadence sensor I had at first, right? Well, I did not throw it into the trash but decided to give it another chance. I did not want to remove and reattach the good sensor from the bike every time when I was trying something out, so I used the cheap sensor on my desk.
It turned out, when I was using the sensor at the desk the readings were there actually quite stable and not nearly as jumpy when the sensor was fixed to the home trainer. However, I must have been looking quite stupid throwing my arms around in the air with the sensor in my fist to simulate the crank rotations for it. So I decided to build a small model where I could fix that sensor to and have it rotate manually. The various parts I had designed in like 15 minutes online with TinkerCAD, and it worked right on the very first try! Awesome! So I could simulate faster or slower pedaling by just turning the handle accordingly.
But while this worked quite OK another problem surfaced. Every now and then it was not able to connect to the sensor due to a bonding problem. The actual error of the peer_manager of the SDK was, that the long time key used for the encryption was not available anymore (on the peripheral). So it looked as if the sensor forgot it’s own bonding information from time to time. The only work around I was able to find was to delete the bonding information in the nRF52 DK and re-bonding of the sensor. And to do this, I needed the on-board buttons and the accompanying code.
I had a support call with Nordic here. You can read up on the history here: https://devzone.nordicsemi.com/f/nordic-q-a/69255/bonding-problem-with-cheap-ble-sensor-and-nrf-dk52
So back to the debouncing problem:
Unfortunately, my pushbutton was of course not equipped with such a filter so I had to find a solution here. Much to my joy I read that the appbutton library of the nRF SDK already had this debouncing built in and could actually deliver “higher level” events to the application like “button was pressed down”, “button was released”, “button is kept pressed”, “button has been toggled (pressed and released)”. This was exactly what I was looking for!
I basically wanted to go for the “button has been toggled” event. The problem is that the code in the SDK was not developed in such a way that you can easily add more buttons than the ones physically present on the board already. That means – if you want to keep the already provided functionality to wake up the board, reset the bonds, etc. which is automatically available if you add and build the necessary files. I wanted to keep this functionality but just add two more button events. This was not possible in a clean way: The necessary defines were buried deep inside the SDK which means, out of my reach, as I didn’t want to change nRF’s code actually just in order to make my app work, because this is bad design in my opinion. By reading the code and following the various defines and sub functions I came up with a solution which involved redefining the pins and states of the nRF provided board support package (BSP) and got it working. My button pressed were now properly debounced automatically and I kept the original functionality of the BSP code. However, I was not very satisfied with this, as the code really looked ugly to me. I opened yet another support ticket with nRF and described my intentions and the current situation. After internal clarification It turned out that were was apparently no clean way of actually achieving what I desired, and my approach was basically the only way to do this. This was somewhat satisfying for me of course, but I hope, the SDK development team might take up on this problem and maybe we will see some changes in the SDK in a later version. Read here more about it: https://devzone.nordicsemi.com/f/nordic-q-a/69253/using-app_buttons-with-bsp-buttons-plus-own-buttons
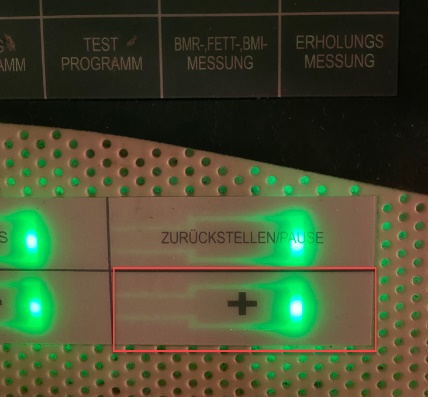
After these changes to my app I was now able to ride along the Zwift track and when the incline was rising I was increasing the resistance on my trainer by pressing “+” and afterwards pressing the “+” pushbutton connected to my nRF52-DK. The application would then react to that press by increasing or decreasing the global resistance level and the power calculation would honor that and deliver an increased number of Watts to the client (Zwift). So, basically, every time the incline was above by x%, I pressed the + button x times both on the trainer and my board and vice versa.
I used my 3D printer to print a minimalistic housing for the buttons and attached them to my home trainer so that they were at least reachable comfortably. The whole setup worked quite well.
But in the end, well, it was a real unsatisfying solution to have to press two buttons manually at the right time in order to be accurately following what the game was throwing at you. And my assumption that I would just increase or decrease the difficulty by one for every percent of incline was just my best guess how to simulate this. I actually had no idea whether 3% incline would correspond to difficulty level 13 on my trainer in contrast to level 10 on a flat track. It felt quite realistic though. (It was not until later that I found out how much harder 5,6,7% of incline was in comparison to setting 15,16,17 on my trainer 😉).
There had to be a better solution for that.
And there is yet another thing which bugged me right from the start of that project and where I do not have a good solution yet. Some ideas – but not a solution. Like we saw, everything depends on the cadence in my setup, right? The speed is derived from the cadence, so is the Watts. What will happen when I stop pedaling, e.g. after a long uphill part and going downhill again to rest for some seconds? The “cumulative crank revolutions” from the sensor will not increase, neither will the “crank revolution time” and as such the delta between the previous and current reading will be 0. 0 times speed factor is still 0. So, the moment I stop pedaling, my speed will drop to 0 as well and my Watts, too. But that is not really the truth, is it? A bike will free roll and become slower over time due to the friction of the road, wind resistance and so on. It will not abruptly come to a full stop. But actually, my home trainer sets the speed to 0 too very quickly after I stop pedaling. There is no free-roll there. But what about the smart trainers? Would they stop immediately? Is it different for the trainer where there is just a roll pressing against the wheel vs. the trainers where the bike itself is fixed to the trainer?
And what about the Watts? Hm, good question? Up to now I am not 100% sure about this. The energy you invested to get the bike to a certain speed is still conserved in it as kinetic energy and is only transformed over time. But I am not actually putting any more additional energy into it through the work of my muscles, right? So… 0 Watts is correct? Or not?
I decided to ask some friends of mine that have an indoor bike or smart trainers and asked them about their observations. It seemed no-one had observed and analyzed how this is used in the game before I asked. Due to the fact, that Zwift has its own way of calculating the speed also made this somewhat opaque. However, it seemed to be simulated like that, that the speed and Watts are set to 0 after some seconds of not pedaling. So basically, this was then at least no big problem if I did it the same.
Another consequence of all this was that I had to do many iterations over my code to fix a lot of arithmetic errors I had in my first naïve implementation. As many calculations were using the delta time between two measurements in the denominator, you know what happened when that value suddenly was 0… my speed for example suddenly became ridiculously high. I had to account for all those potential disturbances in the calculations.
I am just mentioning this to you so to make you aware that my code was far from perfect throughout long phases of the development. I remember very well a nasty bug where I had to rewrite basically the whole speed derivation part from scratch and was working on three lines of a certain calculation for two full days until I finally found the proper solution which could be used in the general case as well as in all special cases so far…
But the 0-cadence topic had other implications as well. I wanted to have the speed smoothly decline instead of abruptly, but I had not only to think about flat surfaces where this would happen after some hundred meters of free rolling in reality. I was also thinking about a downhill track, where you do not necessarily pedal too, but in contrast to the flat track you would get faster and faster over time there.
So, this was completely the complementary to abruptly stopping. In addition, slow pedaling on a downhill track will not necessarily accelerate you anymore, nor would it slow you down. So how to account for all this? Wouldn’t I need to simulate these scenarios as well? I thought that I had to make my model as accurate as possible in order not to stick out of the masses in case my simulated rider was behaving total contradictory to what was expected. I was literally thinking for days how I could model this.
Browsing the web for some information about this I stumbled over some exceptionally good resources that helped me later on a lot.
One of these resources was a paper about Bike physics by Carsten Bielmeier (Sorry, available in German only) from the University of Würzburg in Germany, where he described all kind of scenarios with the correct physical formulas, effects of forces on the rider etc. etc.
You can find that paper here: https://www.physik.uni-wuerzburg.de/fileadmin/11010700/_imported/fileadmin/11010700/Didaktik/Zulassungsarbeiten/HA_1622196_Bielmeier_Carsten.pdf
Thank you, Carsten! You work was very insightful and helped me a lot during the implementation of FTMS later-on!
Another particularly good resource is the book “Bicycling science” by David Gordon from MIT press, https://mitpress.mit.edu/books/bicycling-science-fourth-edition.
In Carsten’s work I found the formula covering free-roll and I was thinking that, when I am no longer receiving crank events, I would be able to model the decline of speed using those formulas. As soon as I would start pedaling that decline would stop and the biker eventually accelerate again. Well, at least once he pedals faster than the current speed, right? As you can see, all those ideas carry a lot of consequences that need to be considered as well. I implemented the free-roll handling into my CSCS calculation, but due to the design I had in the first versions, this didn’t work too well so I eventually disabled it again. Proper handling and simulating of free-roll is something that I will definitely need to look into once I am finished with the major blocks of the app.
Part 3: Interfacing all the things!
I was looking at that trainer again and thought what I could do…
In the end, it was kind of clear that I would need to intercept the event of pressing the + and – buttons to do anything meaningful. The trainer itself had lots of more buttons of course (Reset, Pause, the various fitness programs), but they were basically all pretty useless to what I had in mind, so all I would need to do was to detect when I pushed those buttons. Or… wait a minute… maybe not just “detect”… maybe I would be able to actually “push” those buttons myself via code? To actually manipulate the resistance setting, i.e. I could change the difficulty from within my code! Wow, that sounded like an awesome idea!
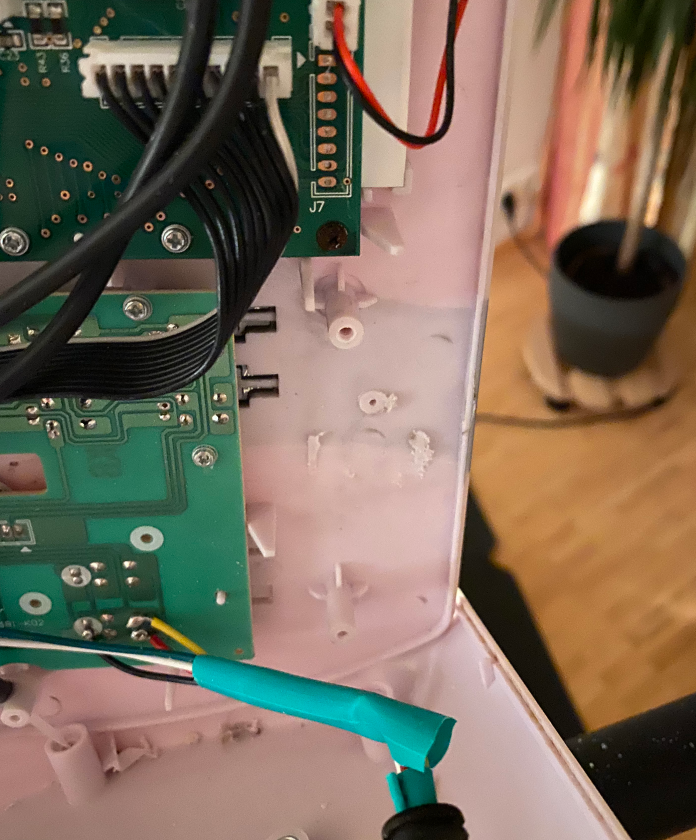
With pounding heart, I opened up the bike computer enclosure and lifted the upper part. What I saw was quite complicate looking PCB with some ICs covered in a black blob of glue in order to obfuscate their model and meaning, lots of SMD components and some cables that were leading into the lower part of the trainer to the magnetic brake and other peripherals. That PCB was basically fixed right behind the LCD matrix.
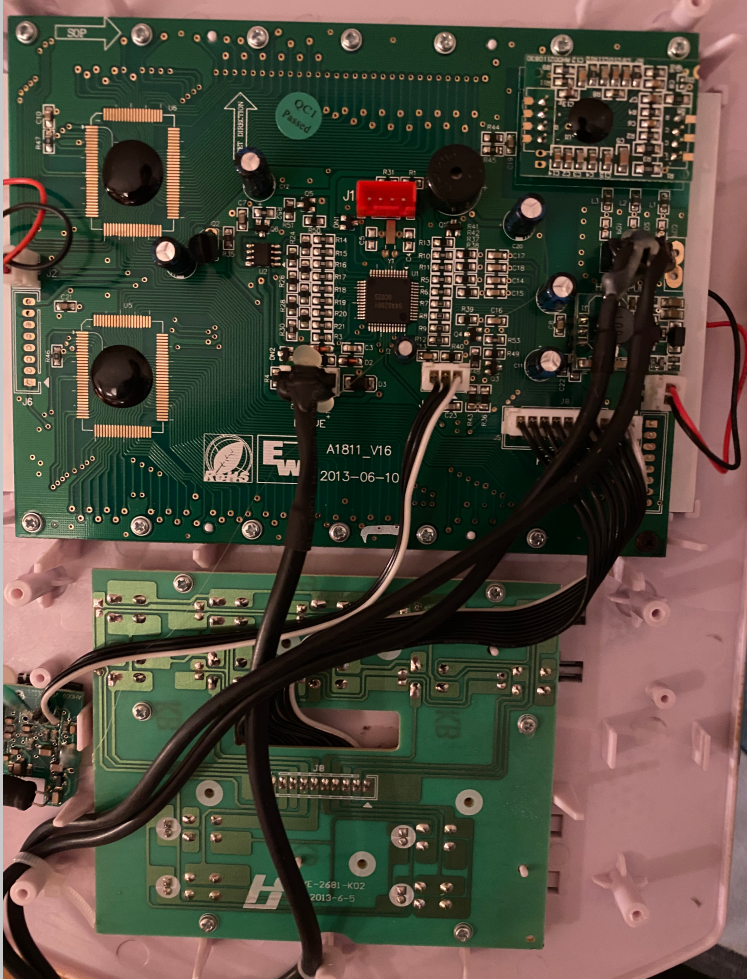
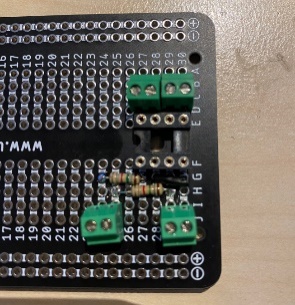
The lower part of the whole construction was the PCB which was behind the push buttons and here everything looked pretty simple and there was next to no SMD component! I was able to immediately spot the circuits that were related to the push buttons. When the device was powered the buttons were lit from behind by a small green LED and I saw the underside of that LED as well (location A and D in the photo below). The buttons seemed to be built like a metallic tongue which gets pressed down when I push the button to close a circuit which results into the change of resistance.
No rocket science here either! So, I started to find GND, measured resistances and voltages at various spots on the PCB when the button was unpressed vs. pressed and eventually found exactly those two spots that were directly affected when the button was pressed. Once I pressed the button the resistance between the points E and F or B and C respectively where almost 0 Ohm and 7M Ohm in the unpressed state.
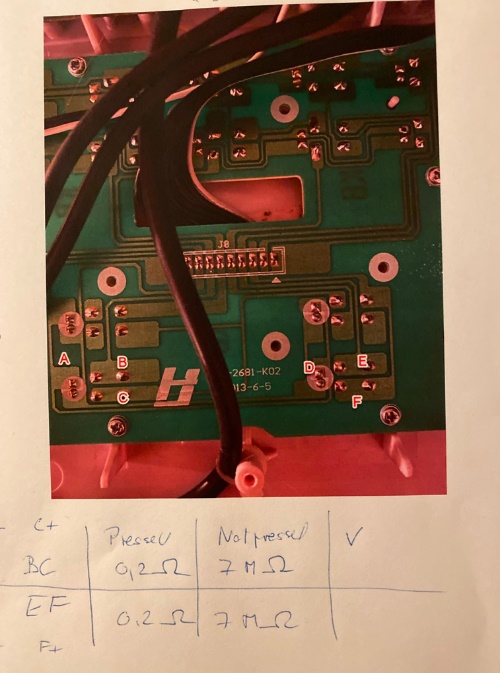
The highest voltage I was able to measure in the area of interest was about 2.7V, which was an odd value, but at least that meant that I would probably not have to cope with a 5V system, whereas the nRF 52 DK was only a 3.3V system. Apparently, no level shifting was needed!
Another very odd thing that I encountered was that when the button was pressed the voltage between the two solder points was not actually 0V, e.g. connect to GND, like you might assume it was, but was about 1.2V.
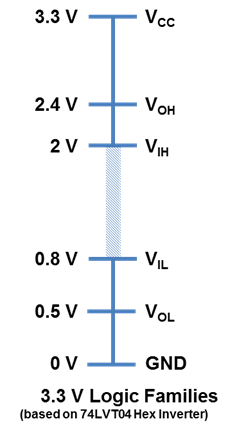
That value is out of the range where it would be safely detected as a binary 0 or 1 (above VIL in the image), so in case I wanted to detect it with the nRF board I would need to have some ADC conversion and check on the measured voltage.
I had not done low level ADC on that board yet, but somehow it sounded not so nice to permanently poll for the current voltage value. As far as I understood there was no interrupt that gets triggered when a certain value is read, just when a value at all was read.
But what was more irritating was that I was not sure what that would mean with respect to triggering an artificial button press. Though I have some light experience with tinkering with microcontroller, much to my shame, I have to admit I am pretty clueless with electronic circuits and components on the physical level. I understand what a voltage divider is, Kirchhoff’s laws and all that but even the various ways you can integrate a transistor or – uff! – an OpAmp in a circuit was over my level. This is surely mostly due to the fact that I never actually had to understand or deal with all this, but now I felt it was about time to change that!
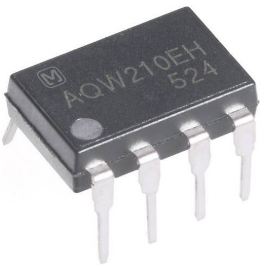
When you’re not sure about a thing it’s a good idea to ask someone, who is more proficient in that field and so I described my problem to a microcontroller forum and asked for ideas how to best address that problem. In parallel I was watching dozens of videos on YouTube about how transistors work, what the basic circuits using transistors or FETs where, which types to use, and so on and so forth. The responses I received from the forum encouraged me to try a PhotoMOS IC instead of a simple transistor because that one would be unaffected by the queer voltages present in the secondary circuit. The PhotoMOS switches the load via a FET that gets triggered by an LED which gets switched on and off in the primary circuit, like an Optocoupler.
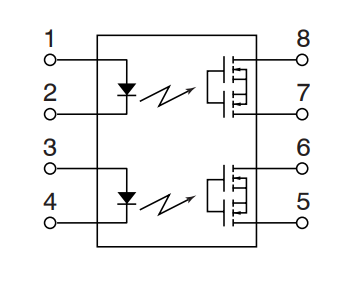
I have chosen the Panasonic AQW212EH for my design, because that component directly integrated two circuits that I could switch in one DIP package. You can read about the specs here: https://asset.conrad.com/media10/add/160267/c1/-/en/000504886DS01/datenblatt-504886-panasonic-aqw212eh-photomos-relais-1-st-2-schliesser-60-vdc-60-vac-500-ma-polzahl-8.pdf
The load was allowed to be up to 60V, which was much more than I would need, and the switching current was just 1.2 mA – also very well in the area that a microcontroller like the nRF52382 could reliably provide. With a micro controller you are normally very limited with the current the micro can deliver to an external component. It is hard to believe but even driving 2 or 3 LEDs can be too much for those otherwise so powerful devices! Nordic recommends limiting the current consumption to a maximum of 15mA for all GPIOs in total. There are slight differences when you source or sink the current, though. I chose to source the current, because that seemed to be easier to implement. https://devzone.nordicsemi.com/f/nordic-q-a/12614/max-gpio-current-for-nrf52
Luckily that PhotoMOS switch was able to operate with as little as 1.5mA, so I could drive this one directly from the nRF52-DK without further peripherals. I’ve added some protection resistors of 1.5k Ohm in order to limit the current flow.
Why 1.5k Ohm? The calculation for this is very simple. The nRF-52DK is powered with 3V. When we look at the data sheet of the PhotoMOS (see above) we can see the PhotoMOS should be driven by 1.25V if possible.
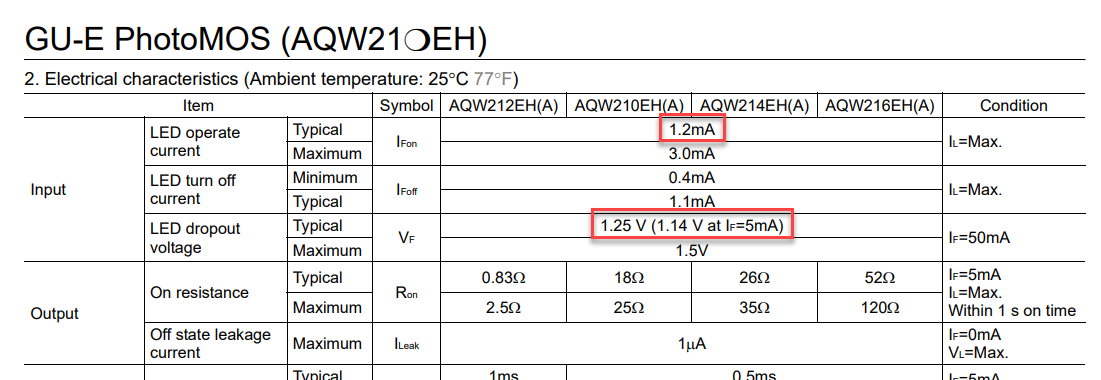
So basically, we want to “burn” 1.75V (3V – 1.25V = 1.75V) at a resistor. The PhotoMOS should be typically driven with 1.2mA so this is also the current which should be at the resistor.
By solving
U = R x I
for R we get:
(3V – 1.25V) = R x 0.0012 A R = 1.75 V / 0.0012 A = 1458.33 Ohm
Up to now I am not 100% sure if I need to put a resistor into the secondary circuit as well. What happens is that I basically directly short the two solder pads that I identified for the button. But my reasoning for not doing so, was that the resistance, when the button was pressed, was actually 0.2 Ohm, so basically “nothing”. I hope it is ok… These are one of those things that I regret I never know for sure… Up to now I did not encounter any problem with this design.
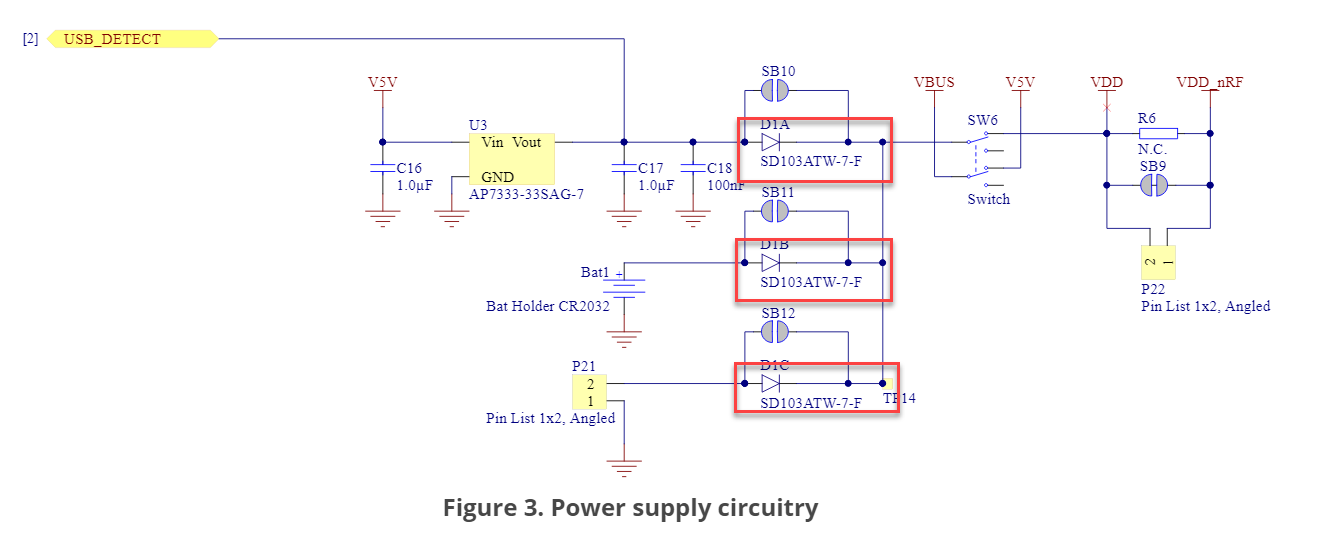
Update: Did not encounter any problem… Well… yes… until I use the nRF52 DK via USB power to run my app. I recently tried to use the onboard coin cell (CR2032 with 3V) and realized it just did not work properly. At first the gears shifted, but during the game I was not able to shift anymore and the on-board LED kind of flickered… I investigated and found out that the voltage measured between VDD und GND was just around 2.5V instead of 3V! Well, ok, the battery was never used and was surely quite old already, so I used a fresh one. But much to my surprise, even with a new coin cell, the result was the same! Again, only around 2.5V! When I rewired to use USB, I measured also only around 2.8V. That is strange, shouldn’t it be 3V? I revisited the DK manual and hardware description (https://infocenter.nordicsemi.com/topic/ug_nrf52832_dk/UG/nrf52_DK/hw_power_sup.html) , and this is when I realized the problem. The DK can be powered either via USB, the coin cell or an external power supply. In order to protect the board, every power supply variant has a protection diode type SD103ATW-7-F. And this diode results in a voltage drop according to the datasheet of 0.5V unless you bridge the solder points SB10/11/12. Bridging those has the disadvantage that when you misconnect something, e.g. mix up + and – on the external power supply, or you’ll connect USB and coin cell at the same time, you’ll fry the chip. That meant the coin cell wasn’t exhausted at all! It was still running at almost 3V (2.5V+0.5V drop = 3V), and that explained why also with USB the voltage was just 2.8V (2.8V+0.5V=3.3V). Happy to have solved that riddle, I also realized that this meant, that I would not be able to ever run the board with a 3V coin cell unless I was going to bridge those solder points, which I didn’t want to do. Primarily, because those spots are also so tiny, I could hardly do that. But when you revisit my description above, you’ll see that my calculation for the PhotoMOS was based on the assumption that I would have 3V and not 2.5V! And that meant that the current through the PhotoMOS was just
(2.5V – 1.25V) = 1500 Ohm x c A c = 1.25 V / 1500 Ohm = 0.0008A = 0.8mA
And that is unfortunately below the expected value of 1.2mA that the PhotoMOS needed. So there was just not enough current going through it to light the LED properly. Even at 2.8V via USB, we would only have 1,03mA which might juuuust be enough to power the LED but is also below the typical value. So, I was even lucky it worked at all so far! In turn, the low board voltage would explain why the on-board LED seemed to flicker.
Of course, I could also unsolder and replace the resistance of 1500 Ohm to use the next smaller variant, but that as well would not solve the problem entirely – and I didn’t want to open the box anymore, as it was quite a hassle to reseat everything properly. At the moment, I am considering to either not use the nRF52-DK for the “final product” but maybe an Adafruit nRF52 Feather or something I could run from a LiPo battery maybe or just use an USB power bank and stick to the nRF52-DK. I did not do any tests so far with the USB power bank but intend to do so. I have quite small power banks as well and as long as they provide enough power for 3,4,5 training sessions it would be totally fine to use those too, I think. Nevertheless, also this lesson was very helpful to me. As I said in the beginning I have very little limited knowledge about all the “low level” electronics stuff and it was very enlightening to experience now what effect and consequences this diode had on the whole application, even if that now imposed a small problem to me! So, long story short: Read you manuals and plan accordingly :-/
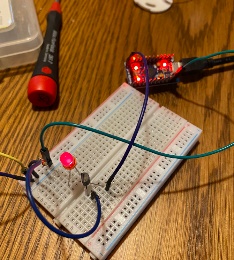
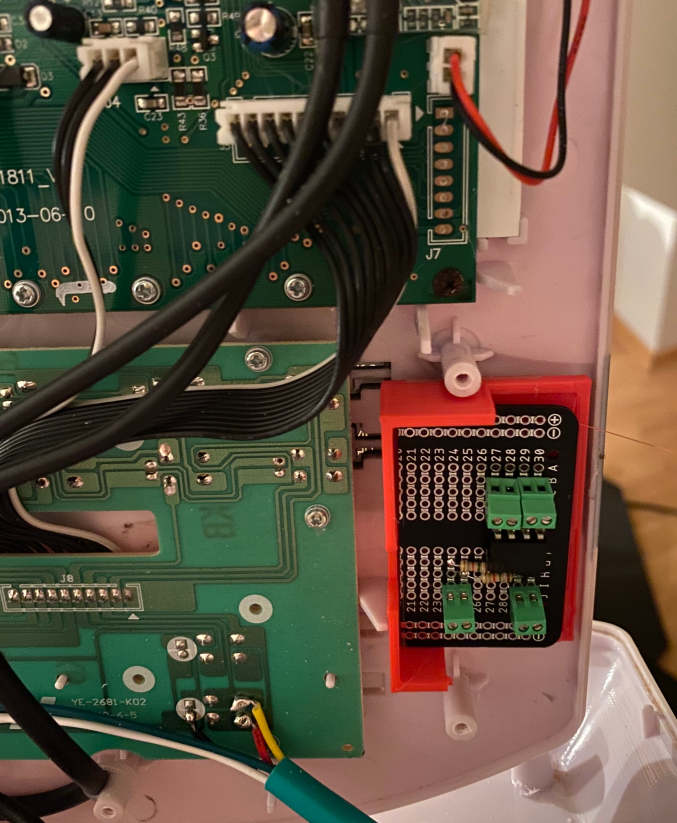
To build my tiny circuit I needed to have some PCB where I could solder my components to. I didn’t want to have some “flying cabling” within the housing and the components potentially causing a short circuit. I was worried enough for overlooking something important and risking frying the PCB the first time I would issue a “Set GPIO high” command from the micro. I build the planned circuit on a breadboard with some jumper wires and LEDs as the load and tested everything. It seemed to work pretty well.
For the first tests I also experimented with a cheap Arduino micro in order to be sure that there was absolutely no risk for the microcontroller itself when I had accidently connected something wrong. I did not want to risk anything with my dear nRF52 DK.
When soldering the components onto the PCB I tried to make the PCB as small as possible in order not to waste any precious space within the housing. Well, as small as possible means here: I can still see everything properly while soldering 😉
Unfortunately, I noticed a decline in what I can still focus sharp on with my eyes over the last few years. Potentially a consequence of spending much time in front of a computer screen in my job…
I ordered some prototype PCBs at Amazon and arranged the components so it would take as little space as possible after cutting the PCB with a hacksaw to become even smaller. If you intend to do this too, please wear a PPE2 mask at least. PCBs contain glass fibers and the dust from sawing those can be very bad for your lungs when you inhale it. So, stay safe and wear a mask.
I soldered some AWG 24 wires to the solder pads I had identified and routed those wires through the enclosure.
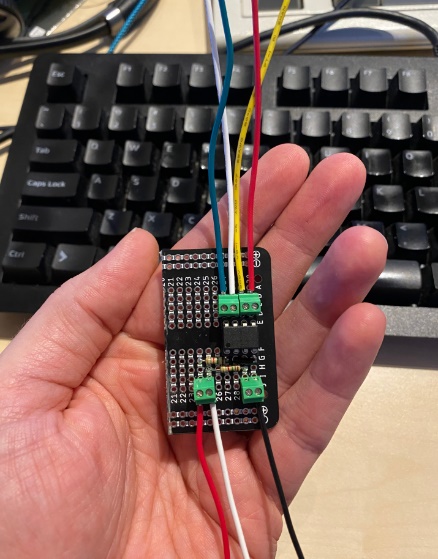
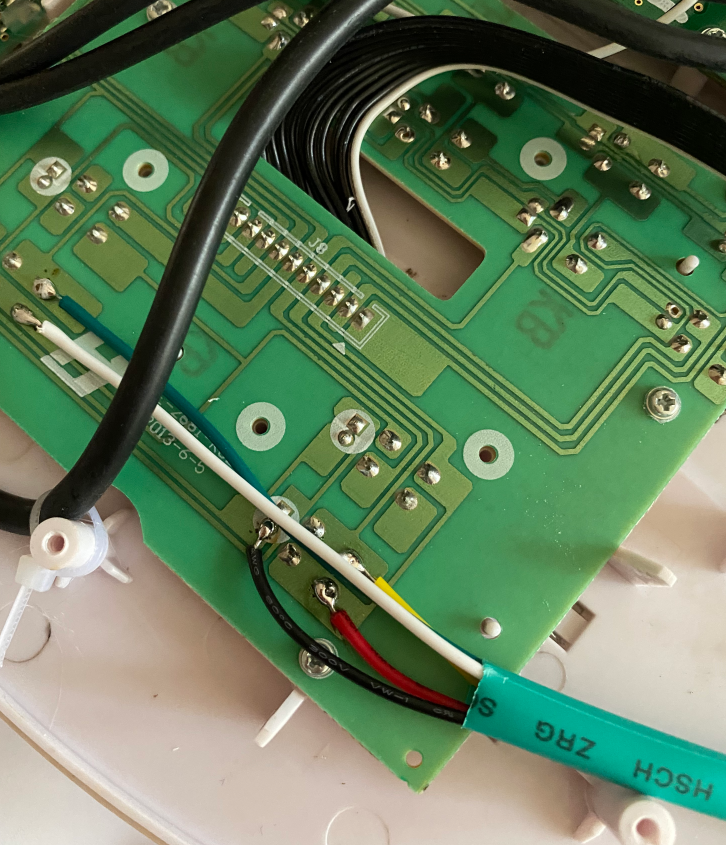
I designed a very small enclose for my PCB within the board computer housing because I wanted to avoid any chance of accidently short-circuiting anything. Unfortunately I didn’t notice, that the wall of the housing was actually very angled below that area already. So at the outer boarder of the housing there were only few millimeters until the lid already contacted the housing. In the end I had to break away most of the printed enclosure again to have enough space, but a little bit of protection is still there nevertheless. Also I had to cut off some plastic clips with my multi-tool to have enough space for the PCB. It’s really funny what a precision work this turned out to be in the end. By connecting the GNDs I needed only three wires in the end to go into the housing (red and white for the two primary side circuits, black for GND), so I was able to save some precious space there as well.
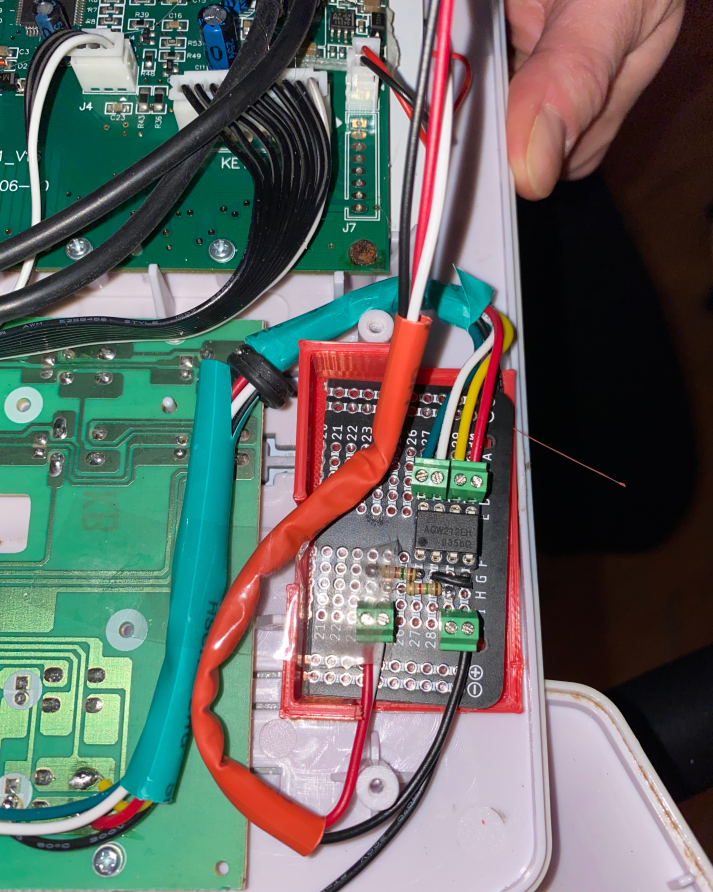
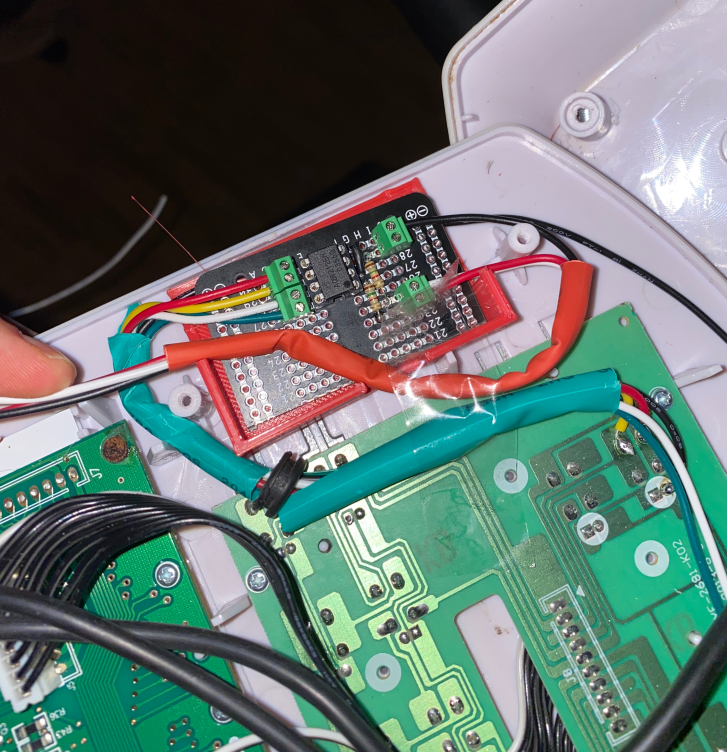
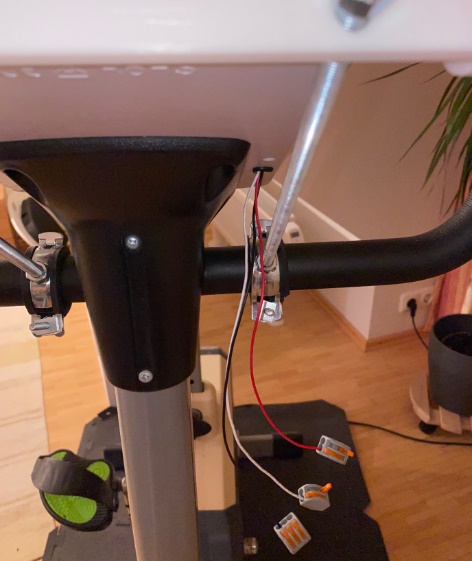
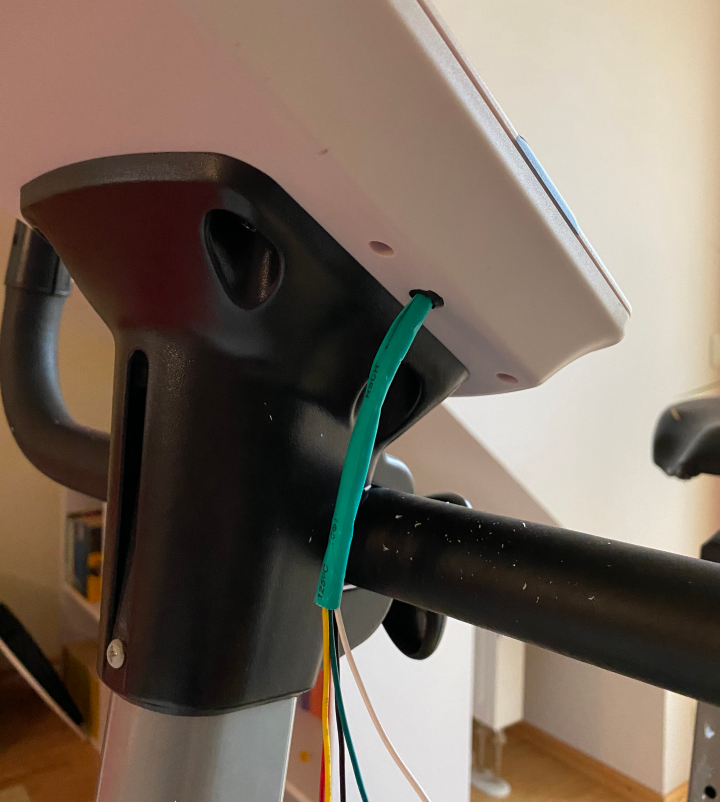
I thought a while how short I wanted everything to cut and decided to leave some space with everything just in case there would ever be some problem with one of the wires and I would have to cut something or resolder. The wires that exit the housing are fixed into some Wago clips and only from there the wires are then routed to the nRF52-DK so also here is a chance to replace something or change some cabling.
When using my app to ride in Zwift, I usually place the notebook about 1.5m away from the home trainer on a cupboard, connect the nRF52-DK via USB and then connect all the cabling via DuPont headers to the nRF52-DK. Doing it like this, I can watch the debug logs on the serial console of the Segger and power the board at the same time. However, once everything is fully finished, I want to detach all this and fix there board somewhere below the home trainer with a small housing. Something that I could fix to the metal rods as well and where I could slide the nRF52-DK in like a bag which also allows for quick disconnect if need be.
While the housing of the home trainer was already open, I also wrapped the tiny buzzer which you can see at the top of the computer’s PCB in some foam to dampen the loud “Beep!” that buzzer made every time you press any button. Though I was not able to fully mute it, the loudness of the frequent beep is now much more endurable.
You surely want to know now if it worked, right? Whether I would be able to trigger a button press on the home trainer via the nRF52-DK via code and increase or decrease the difficulty? Whether I would be able to actually “remote control” the home trainer?
Holding the arc of suspense here
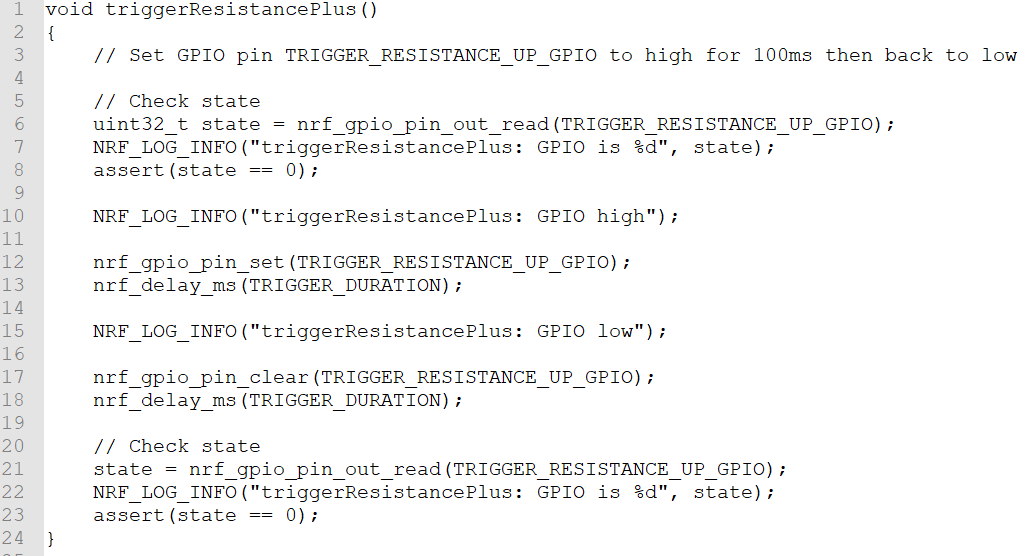 Oh, how it worked! Right on the very first
try! Perfectly! It was such a great moment when I started my small
test program which repeatedly triggered the + button ten times in a row
to change the difficulty from level 10 to 20 and hearing the Beep!
Beep! Beep! Beep!… from the home trainer! Image how awesome this
was! I was now able to remote control my home trainer! And remember!
I still had the push buttons in place! I could now change the
resistance (like I changed it before on the home trainer itself) and at
the same instant adjust my power calculations accordingly!
Oh, how it worked! Right on the very first
try! Perfectly! It was such a great moment when I started my small
test program which repeatedly triggered the + button ten times in a row
to change the difficulty from level 10 to 20 and hearing the Beep!
Beep! Beep! Beep!… from the home trainer! Image how awesome this
was! I was now able to remote control my home trainer! And remember!
I still had the push buttons in place! I could now change the
resistance (like I changed it before on the home trainer itself) and at
the same instant adjust my power calculations accordingly!
It was fantastic to see that I succeeded in achieving that goal with my very limited knowledge about electronic circuits I had before that project.
That was a huge milestone I reached on this project!
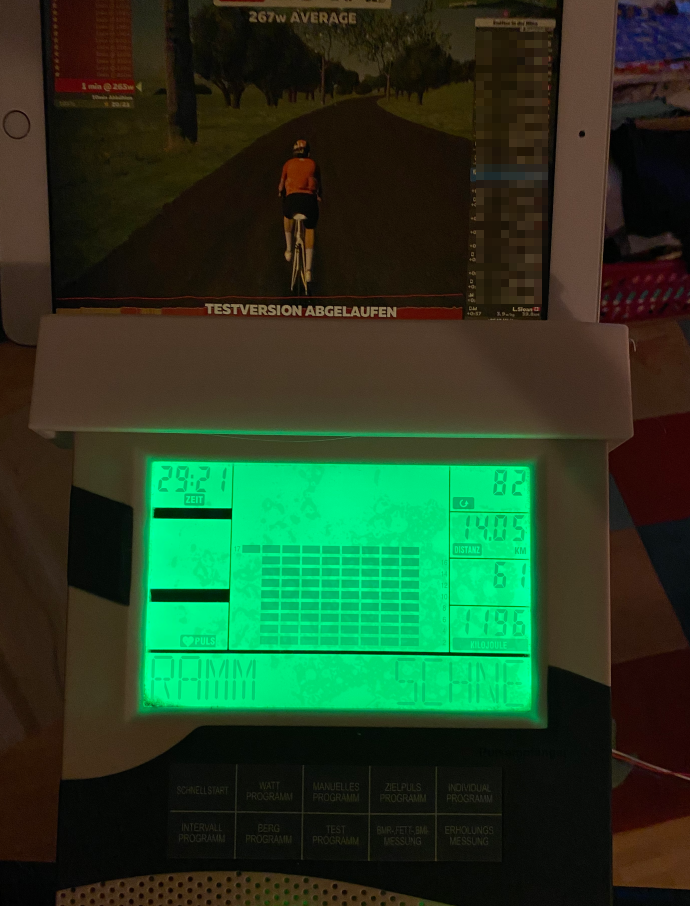
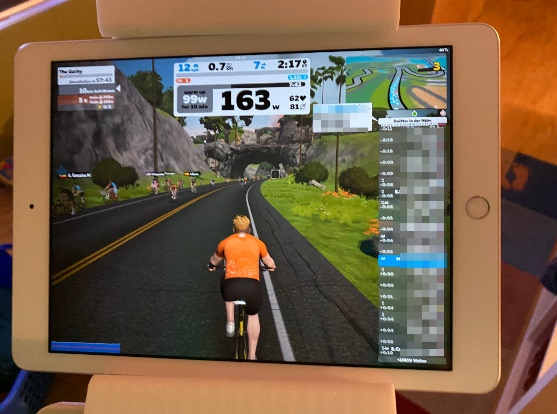
By the way: You can see that the LCD of my home trainer seems to be slowly dying. The left most column of the blocks in the main area is dead for level 1-16 since some time, and also the digit for the hundreds of Watts is dead as well (“61” in the picture actually its 161W). This reminds me to take the measurements for level 21-32 as soon as possible before that display is completely broken and I can no longer compare the outcome of my formulas with the real values on the computer. Thankfully you can very clearly feel the difference between 161, 261 or even 361 Watts even if the first digit is not visible 😉
Part 4: Give it back to me! – Remote controlling via FTMS
I was now able to increase or decrease the difficulty the home trainer imposed against me by the press of the buttons I added to the board. So every time when I ride in Zwift and I would face an incline I would press +,+,+ until I reach the shown level of incline. I had no other means of reference “how” difficult 1,2,3% of incline should actually be, but this looked quite reasonable to me. This worked ok-ish so far, but of course an automated way to set this difficulty would be ever cooler!
Now that I was technically able to remote control the trainer, it was now time to enable Zwift to do the same! The welcome screen of the game, where you paired your devices also had a symbol for a “Controllable device”, so I somehow would need to tell Zwift, my home trainer was “controllable” now. It turned out also for that purpose a dedicated Bluetooth profile existed, the „Fitness Machine Service“ (FTMS). I learnt about that, when I had a look at the Bluetooth captures I received from a friend with an indoor bike which had that service in the list. Reading the specification of FTMS it was clear that this was exactly what I needed! The document can be found here: https://www.bluetooth.org/DocMan/handlers/DownloadDoc.ashx?doc_id=423422
The FTMS is used to operate a stationary fitness machine like my home trainer/indoor bike, a treadmill, or a rower for example. Using that service the device can deliver measurements like the already known speed and cadence data, power, but also things like expedited energy, heart rate zones and so on and so forth. But the real power of this service lies in its control point characteristic which allows the client to write to the fitness machine and initiate actions there. Using the control point, the client can set a target power, a target resistance or incline, a target heart rate zone or can control the start or end of a training and can also configure “simulation parameters”. This was exactly what I was looking for. Apparently, when Zwift was simulating a hill of 2%, it apparently set that incline and – based on my prior idea – I would then just set the difficulty of my trainer to 12 (10 as the basis level plus 2 for the incline). So far, I was always riding at difficulty setting 10, because that was a little bit challenging but not too hard to keep it for a ride of an hour that I did so far. Level 10 was about 180-190W at a cadence of 80 rpm. So, I thought, “Well, if 10 is my ‘normal’ level that I’d do on a flat track, then let’s just try 12 for a 2% incline!”.
Up to now I had no better idea yet than to do it like that, but it looked quite promising so far, so I set sails to that new target.
Unfortunately, similar to what I experienced with the CPS, the information ready to be used in the Internet about the FTMS was even more scarce than for CPS. Again, no implementation was available in the SDK and furthermore I wasn’t able to find particularly much information in the web at first. It was spec reading time again! But that was ok because I now was already used to it.
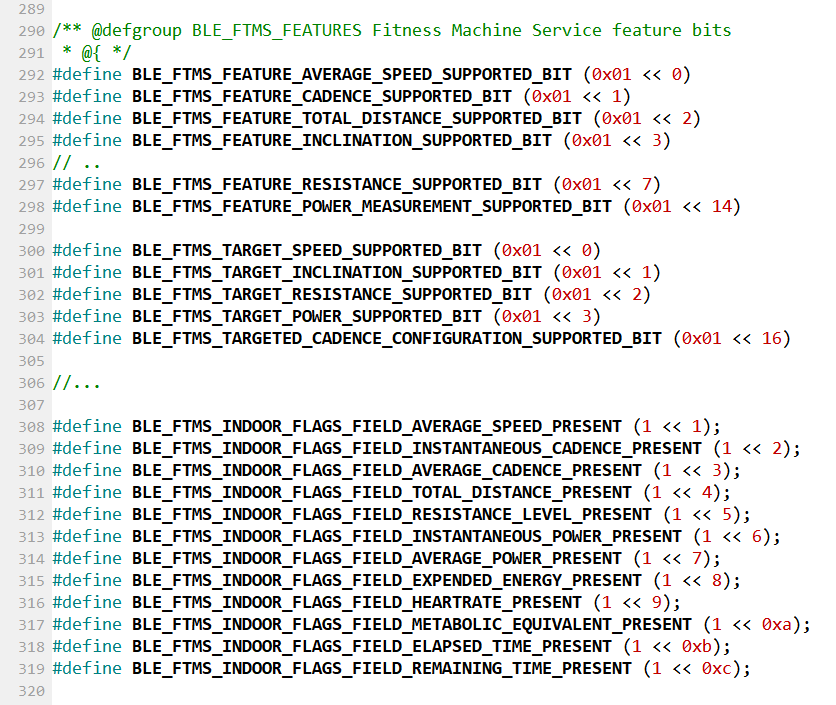
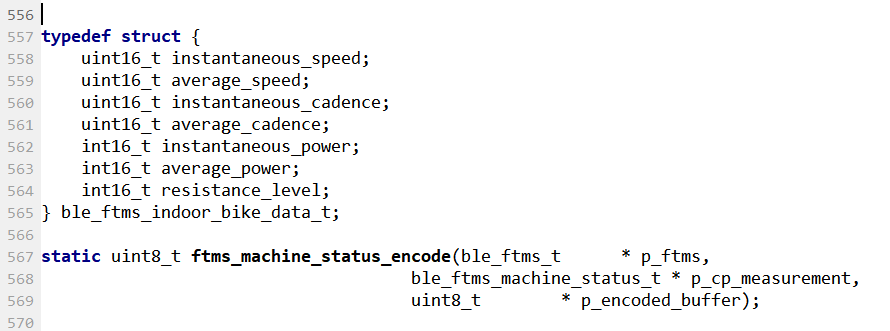
It turned out the FTMS comprised of quite a lot of characteristics. We had a feature characteristic again, an indoor bike data characteristic, a training status, and the control point. Thankfully, apart from the control point everything was pretty clear to me, and it was just a lot of work ahead of me, but not particularly complicated.
Again, the clear layout of the other BLE services in the SDK were my model so I defined a lot of types and structures for the various commands, events, status values and so on and so forth. It is really rewarding when you see how much the work pays off during development, because you have all those constants and clearly defined types in your code to make it very readable and also type-safe.
I knew that CSCS and CPS also featured a control point characteristic but so far I didn’t implement those (properly) because they only allowed for the control of some physical aspects of the devices that I did not really use, e.g. the resetting of the sensor value for “cumulative wheel revs” on the CSCS sensor. So I spend an afternoon to read the implementation again and it turned out it was again much less complicated that I was assuming. You basically had to read a hex blob sent from the client, decode it in a certain way depending on the first byte of that blob (e.g. interpret as two uint32) and then “do something with it”. The only thing new here was that the characteristic needed to “indicate” the response to that command. In contrast to the “notifications” that the server sends to the client whenever there was an update (e.g. a new sensor measurement), an “indication” requires the client to acknowledge that message. Apart from that it seemed to be pretty identical. Thankfully, the CSCS had all that indication handling already implemented and after reading through it, I was confident I could just use it as it was, e.g. copy/paste 4tw!
Now, the FTMS had a couple of “commands” the client could send to it, like SET_TARGET_RESISTANCE, SET_TARGET_INCLINE, SET_TARGET_POWER or SET_INDOOR_BIKE_SIMULATION_PARAMETERS, etc. For me, it made the most sense to implement SET_TARGET_INCLINE because using that command I expected to be able to react to a change of the incline in the game by increasing or decreasing my trainer’s difficulty as described above. I added extensive logging to all my switch-case blocks and various handlers, advertised the FTMS in my main handler of the app and started it up. Much to my surprise, the code immediately worked properly, and Zwift picked up on it and showed a “controllable device” and I saw log lines of my handler dropping in!
Like the spec described the very first thing to see was the attempt of the client to “acquire control” of the fitness device, followed by the “start training session” command. My code handled this properly and indicated “OK” back to the client, as described in the spec. Interestingly, Zwift kept on sending those two commands repeatedly but also didn’t seem to care, when I was replying “ERROR” back after the already performed first “acquire control” (like the spec demanded me to do). Until now I did not figure out why that was happening, but it seemed not to matter what I respond back, Zwift kept on sending those over and over again.
I then noticed that apart from those messages Zwift was just sending the SET_INDOOR_BIKE_SIMULATION_PARAMETERS command all the time with what looked like identical parameters. I had no experience about the actual sequence of messages to expect but assumed that those were one-time commands for a session, so I spent some hours trying to find any bugs in my code which caused Zwift to be misbehaving to what I expected.
It was when I chose to start a workout instead of a free ride when I was finally receiving other commands as well. Instead of the simulation parameters, Zwift was now sending me SET_TARGET_POWER commands with the desired Watts value as argument and those values were actually changing during the time of the workout! Awesome! Now I just needed to think of a way how to actually map those target values back into the “difficulty level” that I could set my home trainer to!
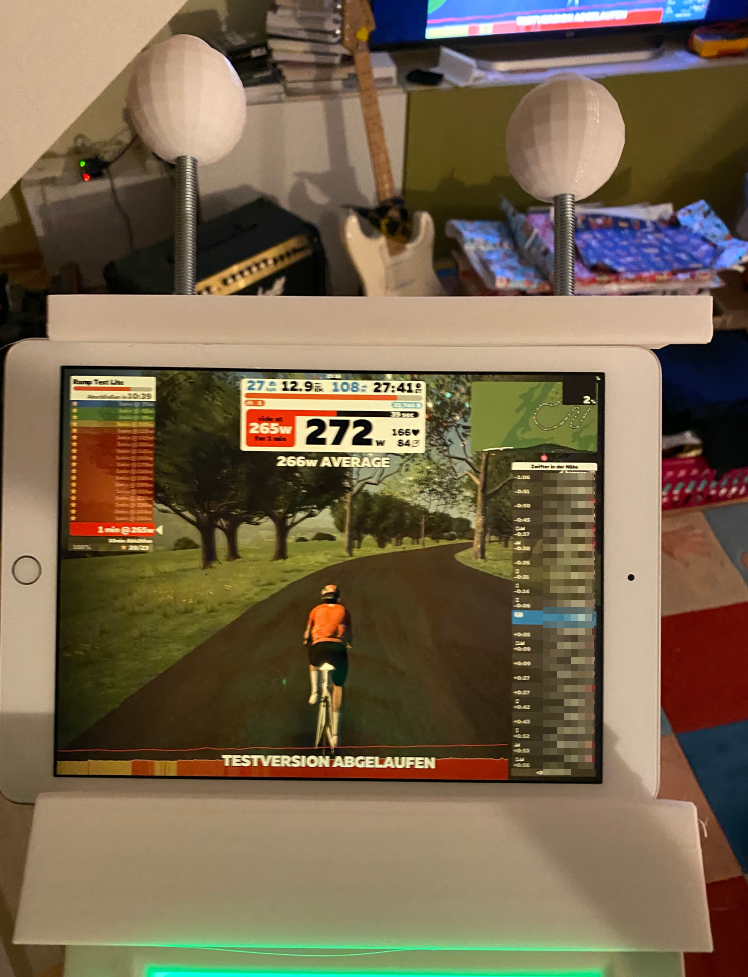
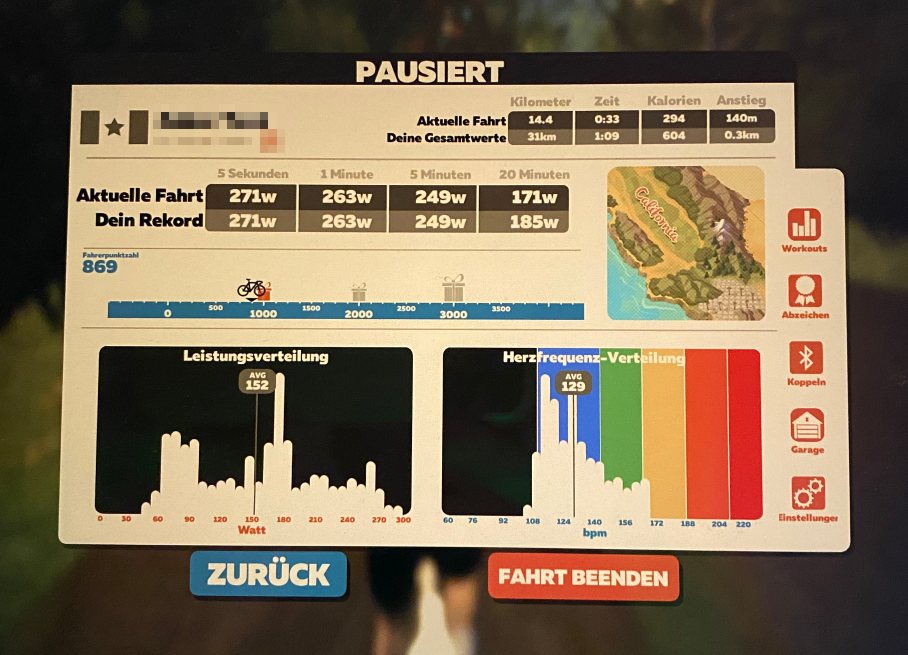
This however was very easy to achieve! I had that routine which calculated me the target power based on my cadence and difficulty level as input using the formulas I derived from my measurement experiments. All I had to do is to reuse that code and calculate the resisting Watts for all resistance levels based on my current cadence and note the difference between the various results for those levels and the desired value. The level which had the least error I considered as the optimal difficulty level to use. As easy as this sounded it was also actually the best way to do it and believe it or not, within like two hours I had a working implementation and handler for SET_TARGET_POWER which controlled my home trainer based on the target Watts Zwift told me. I was now able to use the workouts in Zwift like they were meant to be! How cool was that! The next two days I spend doing “Fitness tests”, “FTP tests”, “Ramp up tests” and so on, in order to be sure everything worked as expected. If you look back at the description of my calculation routine earlier in this writeup you might remember that basically the difference between the difficulty level was mostly the offset of 10W. Therefore an increase of 100W as the target from my current setting resulted in exactly and offset of +10 in the difficulty setting. Having around 180W at level 10 meant I had to go to level 20 for 280W! Level 20! I never actually had used that before! And those ramp up tests were increasing from 50W all the way up to around 250W+ during the workout! You can imagine how I was sweating after the first few iterations. But I was super excited to see it worked perfectly from the code point of view!
Up to that point I did not buy the subscription for Zwift for the monthly fee. Zwift has a free trial phase which allows you to ride up to 20 km per month every month and I took good use of that. For quite simple tests of my application it was often enough to just ride for a minute or two and I was not actually targeting a certain speed or distance. So, I was able to make good use of my first trial account for several days. When you pass the threshold of 20 km within a race you get a notification popup that the trial has now expired but you are still able to continue and finish your current race. It’s only then, that you cannot start any new race or workout afterwards if you do not subscribe. But it’s also possible to just register a new trial account and continue with that one. Of course all your progress in the previous account is not carried over so no one actually wants to do this for long if you are interested in proper analysis of your fitness progress or game rank. Over the course of the development of the app I used up to four trial accounts to be able to conduct my tests and I was finally sure that I could make good use of the paid subscription and would not waste paid game time for hunting bugs and tweaking. After I was satisfied with my results I subscribed to the app and am now paying my monthly fee.
Workouts is one thing but racing or free riding is the other thing and I still had that “set simulation parameters” problem to handle. When I was focusing on that aspect again, I suddenly noticed that the values were not identical all the time but they changed – at least the “grade” parameter! And that was of course the one I was most interested in! The parameters of the simulation parameters where cw (wind resistance coefficient), crr (rolling resistance coefficient), wind speed and the grade. From what I observed only grade was changing, all the rest was fixed to 0 (windspeed), 41 for cw and 51 for crr. Well, as I didn’t know what to do with those at all it was all the same to me and I concentrated on parsing out the grade values and having them result in a change of resistance as I described earlier on. According to the spec the value was 1/100th of percent of incline so a value of 100 should be identical to a 1% incline, 200 = 2%, 300 = 3% etc. The values I received from the client though were very varying so it was nothing like 100, 200, 300 but all kind of tiny value changes in between. I couldn’t make much sense of this. In the end all I was able to configure was a delta of “1” in the difficulty on my trainer that I considered to be the difference between 1%, 2%, 3% etc. So, I’ve configured grade value ranges and the corresponding target values for my trainer and tested my code again!
When the app started the first thing that was happening was that my trainer was set to difficulty level 10 and from that level on, I was executing the delta changes based on the “grade” parameter.
When I was riding on a flat track in Watopia (the fantasy course in Zwift), I noticed grade changes between around 0 and 100 during a 0% segment which was fully ok. Then a 1% and 2% incline appeared and – yes! – the values I received from Zwift were now increasing accordingly. At least… “somewhat”… True, I hit the 200 ranges more often than not when I had a 2% incline but somehow… it was not really aligned… When the incline increased to 3% or 4% the “grade” readings were often still in the 200 range and when it hit 5% or 6% the values eventually climbed into 300, 400 and only in the end maybe shortly into the 600 range. The same was true for declines. Values received by Zwift were fast dropping back into the range of 0-100 when there was still a 1-2% incline or even became negative (downhill track), when the game still showed 1% or 0% incline. I couldn’t make much sense of it and double and triple-checked my code. It was absolutely weird why the game would send values so different from what I saw on the screen the grade was. Also, despite cranking up the difficulty level to 15 or 16 on steep inclines (i.e. 5 or 5% incline), I was often overtaking my competitors with relative ease. Competitors that had overtaken me previously on a flat track and were presumably much more exercised and fit than I was! This didn’t sound right to me. Apparently, a 1:1 match in the incline level to the trainer resistance could not be right?
I was pursuing multiple theories: Maybe it was not really that constant delta of 100 between one percent but larger ranges? So I wrote down the values received at that moment when I saw a change of grade in the game and recoded my routine so it had “soft” intervals not necessarily at n*100 thresholds. This actually worked quite well, and the trainer was now following neatly the increases and decreases in the game, yet it was still kind of weird because this was not really what the spec said. But… well… the spec also said that the client should only send one “acquire control” command followed by one “start training session” and not 100 repetitions of those, right? Also, it was still not 100% ok-ish because there were often outliers in the values though most of the time it was within the expected range. So I considered another explanation that the grade value was not actually an absolute value but maybe like the first derivation of what we already had seen before? What I mean was, the “percent incline” is – as far as I know – always measured as meters increase in height relative to a distance of 100m which is a linear function. Maybe the simulation parameters were kind of “softening” that function or something? So, I experimented for a while by just keeping to add and subtract the received values, i.e. calculating a cumulative sum for the incline but this quickly turned out to be not correct either as the values were quickly becoming totally unrealistic.
Hm… strange… I was discussing the topic with my friend from Italy but he also pointed out that the spec was talking about absolute values and somehow, he was able to find supporting evidence in the Internet by digging out some code snippets or posts on stackoverflow.com which were discussing the FTMS implementations too! Wow, why haven’t I seen those during my investigations?
We didn’t find any good full FTMS implementations but some on-going projects among others the pycycling project on GitHub https://github.com/zacharyedwardbull/pycycling
Reading through the source I was affirmed I was doing the right thing with all the other commands but the “simulation parameters” part of the spec was still missing. I got in contact with the project owner and the exchange that followed was very worthwhile!
For one thing, he explained to me that the FTMS implementation in Zwift was fairly new and most if not all smart trainers on the market are mainly offering the FE-C over Ant protocol for remote control and are only adapting slowly to the FTMS. He also suggested I should read on the Ant protocol specification for FE-C and pointed me to another project on GitHub https://github.com/jedla22/BleTrainerControl which not only contained a FTMS implementation in Objective C but also a PDF from Tacx which described how the FE-C protocol was emulated over Bluetooth! When I looked at that PDF I recognized the UUID of one of those custom services that I saw in the Bluetooth traces I had received from my friend. So they are kind of proxying the ANT communication here over Bluetooth? Wow… but… another service to implement? This was also, by the way, the moment when I realized that the smart trainers were also built around a Nordic nRF51 or nRF52 CPU because that custom service was based on the Nordic-UART service – if I am not mistaken!
But the most important thing he told me was that I had to implement all those FE-C formulas regarding resistance, i.e. take into account the cw, crr, wind speed parts of the simulation parameters instead of only nit-picking the grade value. They were all important in order to calculate the resulting resistance that was set to counter my efforts of pedaling. I felt like an idiot. I was assuming all the time I would only use that grade value and that’s all I need, because how should the real smart trainer make use of “rolling resistance” or my “wind resistance coefficient” at all? I was so wrong! The whole thing was based on well-known formulas of physics that describe the forces acting on the rider the whole time:
-
wind resistance: based on the actual wind speed and the speed of the rider as well as a “drafting factor” which considers if you’re right behind another rider or riding next to him (the angle of attack however is not modeled neither in FTMS nor FE-C). This formula is also known as the “drag equation” https://www.grc.nasa.gov/www/k-12/airplane/drageq.html
-
gravitational resistance: based on the grade(!) level but also taking into account the weight of the rider and the equipment as well as the gravitational constant of 9.81 m/s2!
-
rolling resistance: again considering the mass of the rider and his equipment and the gravitational constant and a certain rolling coefficient constant.
The final resistance is calculated as:
total resistance = gravitational resistance + wind resistance + rolling resistance
However, I still had no concept of that “resistance” or how to map this to the “difficulty levels” of my home trainer. I had the Watts output as the result of my initial formula. How could I map those? It turned out rather easy! Because I could map those by dividing the calculated wattage by the instantaneous speed of the rider.
I could basically use the same approach like with the SET_TARGET_POWER command! Calculate the resulting wattage based on my current cadence, divide by the current speed and get the resulting resistance on level setting X and find that level where the error to the “imposed resistance” given by the game parameters is minimal. This level needs to be set on the home trainer to simulate the actual physical parameters that I have to fight against in the game.
It was then, that I realized that what I was configuring on my home trainer was not actually a “difficulty level” but actually a resistance level. It was just that I couldn’t make any sense of that expression up to now and was therefore just considering it as “how difficult it was” to ride at that level.
I was super excited! Wow! I had to implement some “real” physics formulas considering a lot of environmental parameters and would get in return the “true” value I was fighting against! And – that was what I realized – this also meant I would no longer have to assume that “1% incline is probably +1 in my difficulty level” instead I would now be able to accurately calculate the resulting level! Awesome!
The downside of this was, that I had to implement it, and still I had no code at hand to verify my implementation to see whether the values I get in return would actually make any sense.
The first thing I did was to make use of my ANT developer account to download that FE-C specification (aka “ANT+ Device Profile – Fitness Equipment” but lets keep on calling it “FE-C spec”). An ANT developer account is free of charge, but you have to register at www.thisisant.com and confirm some license agreements with respect to the information obtained. I am not 100% sure if I may discuss the specification openly so I’d rather not but be assured that you can just get the PDF with all the details by registering there. Like with the FTMS the FE-C specification is a huge document which describes each and everything in great details. The concept of an ANT service vs. a Bluetooth service is quite different though. ANT has the concept of “pages” that loosely map to what we know as characteristics or control points in the BLE world. At least this is my understanding of it. I read the spec and suddenly so much became clear what I was unsure about before. It was really awesome to see how holistic, accurate and elaborate all those services were defined! This also explained why I had just observed the two commands for settings a target power during workouts (SET_TARGET_RESISTANCE) and the one for the free rides (SET_INDOOR_BIKE_SIMULATION_PARAMETERS) but none of the others like SET_TARGET_RESISTANCE or even SET_TARGET_INCLINE which was a hot candidate for me, given that I was primarily interested in simulating the incline level!
Also, while I was observing the “START_TRAINING_SESSION” command I never saw the corresponding STOP command which as weird as well. Apparently Zwift has not yet implemented all those things as the target audience was still happy with what they had using FE-C over ANT+ and the user base which just had FTMS was maybe still too small to warrant the development invest here. At least this is how I explain the current situation to myself.
One thing I also noticed was that the specification of FE-C and FTMS had some subtle differences in parts that affected me, like the encoding of the values. Also I read that the drafting factor was an important part of the wind resistance calculation and there was a control page in FE-C which contained that value but as far as I could see there was no such value in FTMS! For me, that meant I would not be able to model the situation if I am right behind someone in the game vs. I overtake someone and experience all the drag from the wind in full! This aspect is quite important in Zwift and I read a lot about it and that proves to me that Zwift was actually using or preferring the FE-C variant, which allowed for the simulation of that drafting factor, before it was using the FTMS.
Hm, but would that mean I need to implement this proxy service as well? Uff.. Another hard core service where I won’t find many implementations to guide me? It probably will end up like that. Up to now I did not implement this but am quite satisfied with the simulation level I have in the game, even if that means I won’t have the benefit of experiencing the slipstream effect.
Over the course of the next days, I implemented the full “set_indoor_simulation_parameters” handler and was able to test it. The first thing I noticed that for riding a flat track, the resulting resistance, and hence the resistance level I had to set on my home trainer, was much lower than my default value of 10. The level was lowered to 2 or 3 per default which meant I was almost pedaling without any noticeable resistance at all! That felt much too easy to me! I wasn’t totally soaked after a demanding track with my old approach but now it would feel like I was doing nothing?
Well, that was only the flat track value… As soon as I was approaching an incline I very quickly realized that my previous 1:1 approach was totally wrong to simulate an increase in incline! Going to a 1% incline the resistance level rose from 2 to 8 (still below my average previous setting), but quickly rose to 25 or higher when approaching a 5% incline. Wohoooo! Now that was much harder to tackle than 15! But the best thing was: It was perfectly aligning to what I saw in the game vs. how the home trainer responded! I was probably due to the sum of the various components of the resistance formula that accounted for the previous strange misalignment between the grade value in the control point and the actual incline I saw in the game. Still I was wondering about the very light setting in a flat track.
When I was pedaling on that level it felt very awkward because I felt next to no resistance. When pedaling faster it was somewhat OK though. Yet, the actual speed I reached in the game was relatively low in comparison to how fast I pedaled… Like if I was on a very low gear… Low gear! The part I was again – or still – neglecting was that on a real bike I would have multiple gears that the rider would eventually shift through whenever the climbs a hill or rides on a flat track!
But now that the game was handling all the environmental aspects the two
- and – buttons I had wired to the nRF52-DK and just for following those changes were somewhat useless! I could reuse them as a gear shift! That sounded like a good idea! But how much would the change of one gear improve on the resistance I had to face? Hm, again I had no idea. Thinking about how it felt in reality to shift gears on a bike, I came to the conclusion that a higher gear would make you faster but at the same time it was of course harder to pedal again and vice versa.
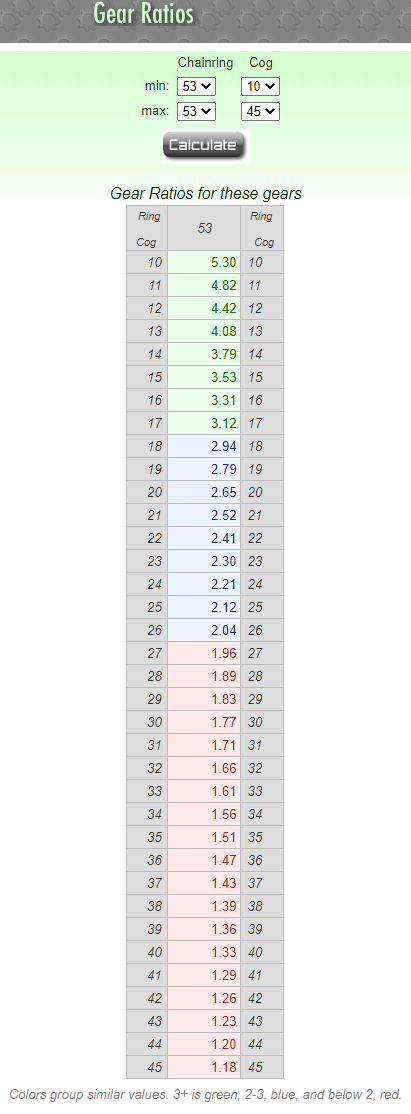
If you remember, back in the beginning of this write-up, I said I had that fixed value of 2.58 that was the factor between the crank revolutions and the wheel revolutions. Well, basically this was the gear ratio, right? And the gear ratio is of course influenced by the gears! So, I thought I could just change that ratio value and in turn add a “penalty” to the calculated resistance level of +2 for every gear above the default level and a -2 for every gear below the default level. This sounded like a good idea! But what ratios to take? Luckily, the Internet has the answers to everything! There is this very good side called www.bikecalc.com, which had the perfect values for you based on the actual hardware that was on your bike! I used https://www.bikecalc.com/gear_ratios and chose to go with a standard Shimano 12 cassette 45-10 setup with a fixed chain ring at 53 teeth. Using those parameters I ended up with gear ratios of: 1.18, 1.33, 1.47, 1.66, 1.89, 2.21, 2.52, 2.94, 3.31, 3.79, 4.42, 5.3. This sounded like a nice value range to me, considering that 2.91 was the default value I was using all the time so far!
The only downside was that I had only a single chain ring whereas real racing bikes normally have 3 (3 rings at the pedals and 11-23 on the cassette at the rear wheel). So, I basically had only a 12 gear bike instead of a 36 gear model, but even 12 gears would be much better than only the single gear variant I simulated so far!
I quickly made all the changes to the code and tried it! It worked! When going uphill I shifted down and it became immediately easier for me to ride but of course my speed dropped as well (and the power I invested too, due to the decreased resistance level). For every gear below my default, I lowered the resistance level by 2 and for every above I added
- These tweaks were added and subtracted after the final resistance level was calculated and then set via the existing routine which triggered the GPIOs.
One thing was odd though.
Of course, the resistance was changing all the time, sometimes every other second during a wavy track. But when I changed gears the resulting effect seemed to be much more exaggerated than it should be. Instead of just offsetting by +2, it looked as if the game indeed did a +4 or +6. Sometimes changing up three times brought me all the way from resistance level 10 to 25 or even higher. And of course, the same was true for the opposite direction. The resistance level was oscillating like riding in a rodeo and it felt very awkward. So awkward I did not dare to try so much at all because of the risk to suddenly be facing a resistance level of 30. I was thinking why that was and was eventually consulting with my contact again. He told me I should not need to account for the gear shift at all, because there is no such thing as the gear ratio or anything in those resistance formulas. Hm… not at all? But wouldn’t I have to “pay” a penalty for the changed gear? Like I recalled, a smaller gear made it easier for me and a higher gear more exhausting to keep pedaling at that pace? Should I totally neglect that effect by not using an additional offset on top?
Exactly.
Nothing is needed at all. Can you see my mistake?
The side effect of changing gears is… the change in speed! In a higher gear I will be able to reach a higher speed due to the changed gear ratio… But that higher speed comes at a price… Wind resistance! Look at the drag effect formula again here https://www.grc.nasa.gov/www/k-12/airplane/drageq.html
The velocity is squared in that formula. A doubling of the speed would case a foursome increase in the drag effect! That was the thing I was experiencing when shifting into a higher gear. The increased wind resistance when I was riding faster! And in consequence, that higher wind resistance had an influence to the total resistance which in turn had an effect on the calculation of the optimal resistance level I had to set on the trainer! The moment I switched gears, the gear ratio resulted in a higher instantaneous speed which in turn resulted in a much higher Watt and therefore resistance result which increased the resistance level. And on top I still added up my custom penalty! But that was already handled automatically due to the change in speed! This was the cause for the oscillating because the whole system of course had to equilibrate itself on those external parameters which took a few seconds. So, the logical consequence was to just remove any offset.
And suddenly everything worked very nicely. When riding a flat track the resistance I felt was still very low but as soon I started climbing an incline the increase in resistance could be felt very well. For an incline of about 4-5% I was now already in the 20-something range of my trainer. When I then pushed the “gear down” button the code kicked in that changed the transmission ratio, which in turn resulted in a lower speed and in consequence the resistance I had to overcome was lower than before as well which in the end resulted in a decrease of the resistance level on the trainer until I was all balanced again. I noticed that is was a little bit depending on the situation but usually shifting down one gear resulted in a drop of 3-4 resistance levels on the trainer (and vice versa).
One thing I noted as well was that the detection of a button press was very accurate, and I could press the button very quickly 3,4 times in a row and it was perfectly detected. However, when pressing the button during the game I noticed a very noticeable lag until when the actual shifting was taking place. In some situations, the button press was even not recognized at all and I had to press some more times until an actual gear shift occurred.
I started to investigate what the cause for that behavior might be and tried various things, e.g. using the SEGGER runtime library in contrast to the default runtime library, compiling a release build instead of the debug build, but the result was actually not noticeable. Again, I visited the nRF devzone community webpage and searched for posts of a similar topic. Maybe, the CPU was just too busy to handle everything in time? I surely had a lot of code already that had to be executed every second. I found some posts which covered the aspect of measuring the runtime of a function in ticks of the CPU’s real time clock. I added the relevant code into my project and printed the code execution time on some of my routines where all those calculations of speed, cadence, power, etc., were taking place and printed the runtime in milliseconds. And the runtime was… 0 ms! Hu? At first it looked as if my code was buggy, but it turned out, it was not. I just had to print more fractions of the milli-seconds. Yes… actually the whole calculation was taking like 0.03 ms! Wow! Looking at the function suddenly showed something around 10ms… Almost the 100-fold runtime! What was going on there? The guilty code was quickly found! It was the logging to the UART/the host’s serial console! It turned out, every single logging statement accounted for about 5ms of code execution time! Wow, that was a lot in comparison! I stripped down the logging and made it more dependent on the actual logging level, so that during normal operations I only had 1/10th of the logging that I had before! The whole application became much more responsive!
But there was still more to optimize! As I described earlier on, I intented to make the whole app as modular as possible, e.g. to keep all the CPS code self-contained and as little as dependent on CSCS as possible. Because, maybe I wanted to do a CPS stand-alone app in the future without all the dependencies on CSCS, right? But that also meant to duplicate a lot of code and calculations in CPS (and also partly in FTMS), that were in CSCS. It was time to refactor all that. Over the course of the next week I created a new module which was basically doing all the heavy-lifting of the whole app. The measurement of the cadence sensor was fed into that module and the actual calculation was performed by a timer handler on a fixed interval once and usable by all services. Of course, this came at the price of higher cohesion, but I decided that it would be worth the effort. Like with every refactoring, this was also the time, when I realized that there was a lot of unnecessary or overcomplicated code somewhere, that I did not actually need the way it was previously assumed and that I could get rid of. During this refactoring, I also found an issue in my speed derivation code that I had noticed before but did not act upon previously. The speed I was delivering to Zwift was always approximately 10% lower than it should have been based on the actual readings. I was confident it might have been only a small issue…
It turned out it was not 😉 It took me three whole days to correct that issue which was related to the derivation from the cumulative wheel revolutions and timestamps based on the cadence data. It was tearing my hair out because I just did not spot where the actual problem was. The code was working pretty well, but there was that issue that the calculation was totally off either during the start phase of the simulation for 2,3 readings or sometimes also when a gear shift occurred. Basically I had insane speed measurements of several thousand km/h. So far, I had just ignored those and filtered them, but I intended to fix the root cause. Well, I figured it out in the end and basically it was a thing of misleading naming of variables when I added some offsets to the wrong variable, but it was definitely not easy to spot. Now everything works very well, and I am satisfied with the whole thing.
There is still some thing I did not yet tackle, though. I am still not properly handling the situation when I stop pedaling and am not receiving a change in the cumulative crank revs and the corresponding wheel times. Currently, I just ignore that scenario and pretend nothing has changed and do not calculate new values derived from that. This means my average cadence but also the speed stays the same! So, basically this means, that I cannot come to a full stop. All I can do is to continue pedaling very slowly to get the cadence lower and lower. Funny enough, this restriction has zero effect on the actual game itself. It turned out I never face that situation, only at the very end after the finish line when I am about to end a session. Even during downhill phases in a race, I kept on pedaling and did not free-roll.
Anyway, I think I should be able to handle this as well and have some ideas for this already. In one of the books and articles I had already mentioned I found some references about free-roll functions and the decrease of speed when you stop pedaling. I had already modeled that in a previous version, and it worked as it should but there were some issues involved with this approach so I eventually removed that part of the code. I will surely revisit that topic again!
One thing that still was a little bit cumbersome with the whole design was, that I still needed my notebook and the logging via UART to see what was going on, like what the resistance value was, which gear I was in, what my speed and cadence was (ok, this is displayed in Zwift as well, but nevertheless). Also, I was planning to power my board via a battery or USB power bank to become independent of the laptop. So I was looking for some small displays which I could use as a kind of status display, which showed me everything I wanted to see in one “dashboard”. Of course, I would not have the space on my trainer to fix a big TFT and using such a big screen would also contradict the idea to power it autonomously. Instead, I was looking for a quite tiny screen and found out, that OLED displays became quite common, cheap and power efficient over the past few years!
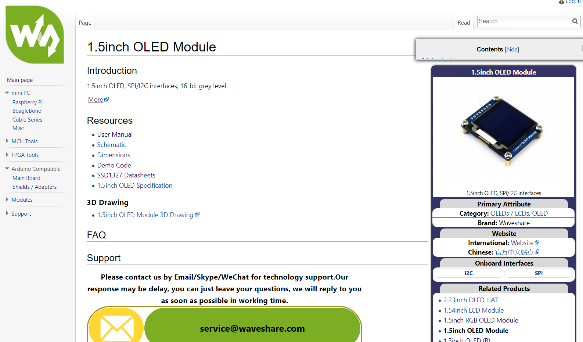
I already owned some 7” HDMI displays from Waveshare (a Chinese manufacturer) I used for my Raspberry Pis. Waveshare also had all kind of OLED displays in black/white, grey scale and even 16 bit color that you could use with an Arduino – or any other microcontroller for that matter. The size of the displays was still quite small with the biggest one only being 1.5”, but in the end I was looking for a tiny screen after all.
I ordered one of those black/white OLEDs as a start that I could control via i2c or TWI (Two wire interface) at it is called as well. Often those kinds of displays are also addressed via SPI (Serial peripheral interface), but SPI already used 3 or 4 control lines whereas TWI only used two (hence the name). Together with VCC and GND it was already 6 wires I had to use just for that purpose, and this appeared a little bit unattractive to me so I decided to go for TWI – at least until I was sure that everything worked how it should.
In the past I had already used i2c to read out some simple sensors like an LM75, but interfacing a display was a totally different thing! You have to deliver the frame buffers to the display controller, set all kind of parameters and initialize everything before you can even set a single pixel or write a text to the display. Luckily, you don’t have to start at zero here. There is this awesome graphics library called u8g2 on GitHub (https://github.com/olikraus/u8g2), which is a ready-to-use library for Arduino and that supports a large range of display controllers, among those that are used on those Waveshare devices.
Luckily, the library is not only usable on Arduino. Well, of course it is not. In the end it’s just C code and the usage of the Arduino’s HW peripherals for sending the commands and data to the display. However, the author of that library explicitly considered the case of using the library on other microcontrollers, so he exposed all the necessary handlers and routines to interface the hardware of a different board or architecture and the wiki for the project also had some tips how to port the code to a new architecture. The Waveshare product page also had code for the STM32 platform which I looked at, but of course the API to use the on board peripherals like the TWI was different on the nRF core so it was usable as a reference but nothing I could use as it was.
The basic idea was to write a handler routine which is then handed over to the u8g2 library upon initialization. The library calls that function every time it wants to perform an actual I/O operation so all the device specific code could be just in there and is not scattered all over the place. This is a very neat approach actually the only thing is, it took me some time to actually understand that approach to its full extent, because in the beginning I felt completely lost.
Much to my dismay I had not a single TWI sensor at my disposal when I was looking for such a device to try to interface it with the nRF board. I had used neither TWI nor SPI with nRF before, so I thought it would be a good idea to start with something easy before trying to write that handler routine for the display. So, this was unfortunately not an option and I had to do it the hard way.
I was reading up on the TWI peripheral of the nRF and the accompanying functions. And then, there were of course again example projects in the SDK that use the TWI. They were relatively simply build of course and did not account for the complex interaction for an OLED display but I understood the basic approach. So, I was using that function template of the u8g2 library and was coding the relevant calls into the nRF SDK which perform the TWI setup and I/O into it. The first test I conducted was, if the display was reacting on the pre-assigned TWI address, so I had wired everything correctly. What shall I say… not even that worked out of the box. After reading some pages in the datasheet of the display controller I eventually found my mistake (It was actually the wrong TWI address) and was able to “find” the display on the bus!
The next problem was that I only had experience with TWI insofar that I was writing a command byte to the device and then reading the result, like for example with that simple LM75 temperature sensor. But here it was a little bit more complex. The display expected a sequence of values and commands to initialize and to setup everything. Then you had to send the actual data to display. I tried to mimic what I saw in the Arduino examples and filled the handler function with everything I considered necessary. After about one hour of fiddling around the display suddenly showed a lot of noise after initialization! Wow! I had achieved “something” :-D
In retrospect, I can now say I would have never been able to do that without the help of a very valuable tool and even with that tool it took me almost a day to understand what was actually wrong and how to fix my code. Of course, this will be different for an experienced embedded developer, but I am none and as such was not accustomed to these problems. The tool I am talking about is a logic analyzer. For those of you, that don’t know what this is, let me explain it in few sentences. As well all know, microcontrollers are digital devices, so they differentiate between 0 and 1 only (let’s keep the analog-digital-converter peripheral out of scope for the moment). So, basically, if you observe one of those lines that control a sensor or the display of the OLED with a voltmeter, you will see an alternation of pulses where the voltage is either on VCC level or on GND level. The clock signal for example is a constant alternation between those two states at fixed intervals – a square signal.
OK, and when you have multiple lines like for TWI you have SCL and SDA (serial clock and serial data) or for SPI you have SCK, DI, CS, … and the signals on all those lines follow the same principle. They encode the bits of the information you are sending to the peripheral using a sequence of pulses between VCC and GND.
OK, fine, so what? Well, if you use a ready-made library or “sensor driver” on your platform of choice like for example an Arduino, you probably don’t care at all about this behind the scenes details, but if you intend to port this to another platform like here for the nRF this becomes very important when it comes to debugging. How can you make those pulses visible in order to see if everything is fine, timed appropriately and in the correct sequence? Well, you could of course use an oscilloscope! The thing is, most oscilloscopes are just displaying the voltage levels and that’s what they’re very good at. But what we want to see is… the length of the pulses, the correlation between pulses on different lines and – can we maybe even decode what is pulsed there? Yes, we can! A logic analyzer can do all that for you and in a very convenient way! Like with an oscilloscope you connect your probes to the data lines and GND and then you can measure the signals on those lines. Oscilloscopes often only have few inputs, maybe even only two! This is ok for TWI – but even for SPI a two-input oscilloscope is not enough. Modern oscilloscopes are also able to decode the data and have all those fancy features like doing a Fast-Fourier-Transform (FFT) of the signal and all that, but good oscilloscopes easily cost you a 4-digit amount of money if you want something professional. A logic analyzer now is a device which is specialized on exactly what we just described! You could maybe say it is not so versatile like a real oscilloscope, but even that is no-longer totally true these days. All logic analyzers I know of are connected to a PC in order to process the sampled data whereas oscilloscopes still are mostly stand-alone devices though more and more have an interface to a PC as well. But the thing is, logic analyzers can do one thing very well: Sample digital signals on many inputs, very fast and analyze and decode those signals very precisely. The software you use for those logic analyzers is targeted to exactly that use case and many vendors feature many protocols they can decode. To mention a few: TWI/i2c, SPI, UART, CAN, some of the professional high-speed models can even decode USB2. Well, what do I mean with “decode” precisely? Exactly what I say! Take UART for example. Over the UART interface you send for example log messaged from the board to the serial terminal on the PC. And “decoding” UART traffic means you see exactly those messages – in the logic analyzer! So, if for some reason your UART received code just prints gibberish and you have no idea where the problem is – is it maybe already sent incorrectly by the sender? Or just incorrectly received by your application, e.g. with a wrong speed setting? Use the logic analyzer to find out! If it can decode the message properly and your receiving code does not, chances are, you have a bug there. Of course, there are more complex protocols or products – like display controllers – which require a precise orchestration of messages on various signal lines at the same time, where it is not so simple to just spot a “Hello world” in the decoder! Here you would need to correlate the parts where the clock signal is active, consider whether the device on the bus was correctly addressed (TWI for example allows for multiple devices on the same signal line!) and then decode the message, which might often be binary. But all this is done by the logic analyzer for you! It’s like a swiss army knife for that kind of job.
OK, now why I am saying all that? Because I am so happy that I had just bought myself a logic analyzer when I started that project and without it, I probably would not have been able to succeed in interfacing the u8g2 library with my nRF board.
When you plan to buy a logic analyzer you will find quite some products on the market. Especially when you look at eBay or Aliexpress you will find “logic analyzers” for an insanely low price of just around 25 EUR/USDs. To make a long story short – you get what you pay for. Those gadgets usually are not even worth 25 EUR. Some of them even come without software, so you need to find one yourself based on some open-source project and hope that it will work with your device or you can only use it with the vendor’s software but they didn’t care to include even the most essential features you would need to properly do what the device is used for.
Others again can only record to an internal buffer which barely is large enough to sample for 1 or 2 seconds. Now imagine you want to analyze the SPI traffic and you need to precisely time the recording so that everything is captured, and nothing is missed. Have fun. You will spend more time trying to trigger the recording properly instead of working on the problem that you want to analyze.
I have been there before, so I have seen all that. I still have one of those 25 EUR gadgets in my fundus, but I do not even use it anymore because of the aforementioned problems. So even 25 EUR spent is too much, if you do not use the device at all then.
Once you ignore all those advertisements for the cheap gadgets you will inevitable stumble over another product name and I can only recommend to have a look at it. It is the “Logic” from Saleae (https://www.saleae.com). I have known that company name and its reputation for many years already. Saleae produces a very professional device and bundles it with an awesome software for the analysis. You can choose between two 8 input variants and one high-end 16 input variant. The software is super simple and intuitive to use but is very powerful. You can measure intervals, average levels, decode a myriad of different protocols, zoom the signal, scroll fast, search for certain values, etc. etc. etc. Saleae is a big player, and to be honest, it was one of those products, that I always wanted to possess because it is also simply a “cool” and very professional product that is just “fun” to use. However… everything comes at a price, right?
When you arrive at the web page, do not be put back when you see the prices of the current models. The entry level model starts at 329 USD, the mid-range model is 579 USD, and the top model is 819 USD. That might not be very much money for a corporation which uses this device for the development of a new product, but even 320 USD is a lot of money for a hobbyist who just needs a logic analyzer occasionally to troubleshoot a problem, like I had now in front of me. Instead of sighing and browsing away from the webpage focus your eye on the link “Student, Enthusiast, Startup or Contractor?” and click on it. Might be I never noticed that before or maybe it’s something new, but for those groups of buyers, Saleae offers a very competitive discount for it’s products. The entry level model for example can be bought by students or hobbyists for just 199 USD! “Well, 200 USD is still a lot of money, buddy!” I hear you say. This is true. But let me assure you one thing: The product is worth every penny of it. In fact, it is worth every penny of the “official” price, but to be honest, I probably would not have paid the full price as a hobbyist. Do not overlook the fact that also the mid-range and top-model have a discount price, but you will need to get in contact with Saleae in order to get the discount code for their online shop. “Getting in contact” is dead-easy though because they also have this online chat feature on their page and it’s not that AI bot type of chat but real persons. I got the offers for the other models as well and was thinking for a day about how to decide and eventually bought the mid-range model. Two(!) days later, the postman handed me over the parcel after it was traveling over 9400 km from the San Francisco Bay Area to my house. Mind blowing! The setup was super-easy. Saleae has just released a version 2 of their analyzer software which runs not only on Windows, but also on Mac and Linux! What I really liked about the product was the professional look and feel. The unit itself is in a metal housing, everything looks super smooth for example the probes are connected using a solid connector to the Logic Analyzer and you don’t have to connect every single probe with it’s own connector. These might be little aspects but these all sum up to perceiving the product as a real professional device with a “feel good” factor.
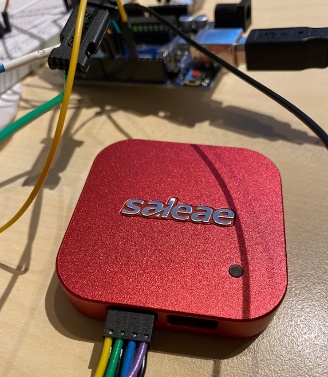
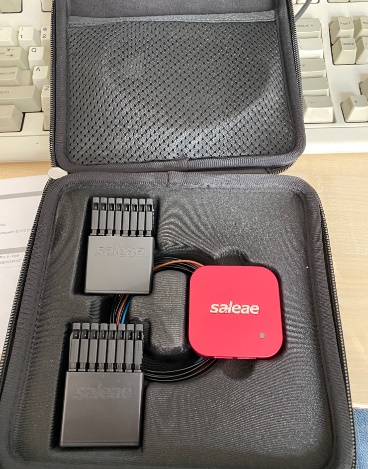
You connect the probes to the device, plug in the USB cable, start the software and there you go. For the sampling of the data you have multiple options. Just push the record button and get the data flowing for a certain time or until you press “Stop” or use the trigger to start the recording whenever you see a certain event on one of the signal lines, for example, the beginning of the clock signal on the SCK line which is the indicator that the transmission started! Using those triggers makes it super-simple to only record what you really want to look at and don’t have a two minute recording that you only need two seconds of!
So, what I did was to record the whole sequence of a simple “Hello world” string display on the OLED on my Arduino (where the example worked right out of the box of course) and compare it to what I had on the wire with my nRF board. I was using a SPI driven display here, as eventually I wanted to use one of the bigger OLED variants that only come with SPI instead of TWI.
Looking at the traces It was evident that something was really odd here:
This is how it should like:
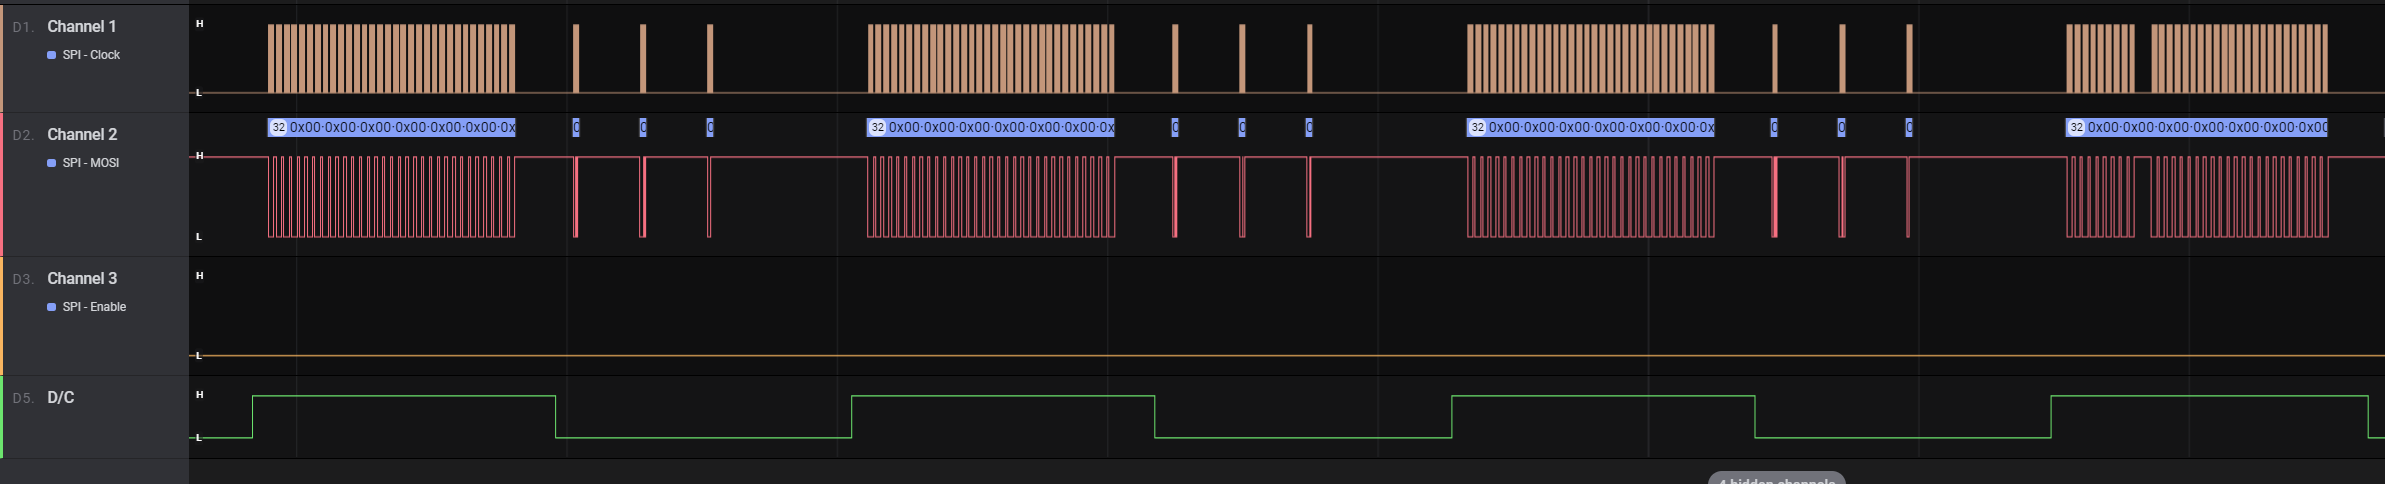
What we see here is that we have a bunch of data bytes (DC is high (green line)) followed by short spiked of command bytes (DC is low) and repeated over and over again. By the way, DC has nothing to do with “direct current” but means “data/control” here – a signal which tells the peripheral whether the send bytes are to be interpreted as commands or data. In the top row we see the clock signal which needs to be present all the time, when actual data is transmitted (2nd line from top, red sequence)
In contrast, what the data send by the nRF was something like that (different magnification level, but you get the picture).
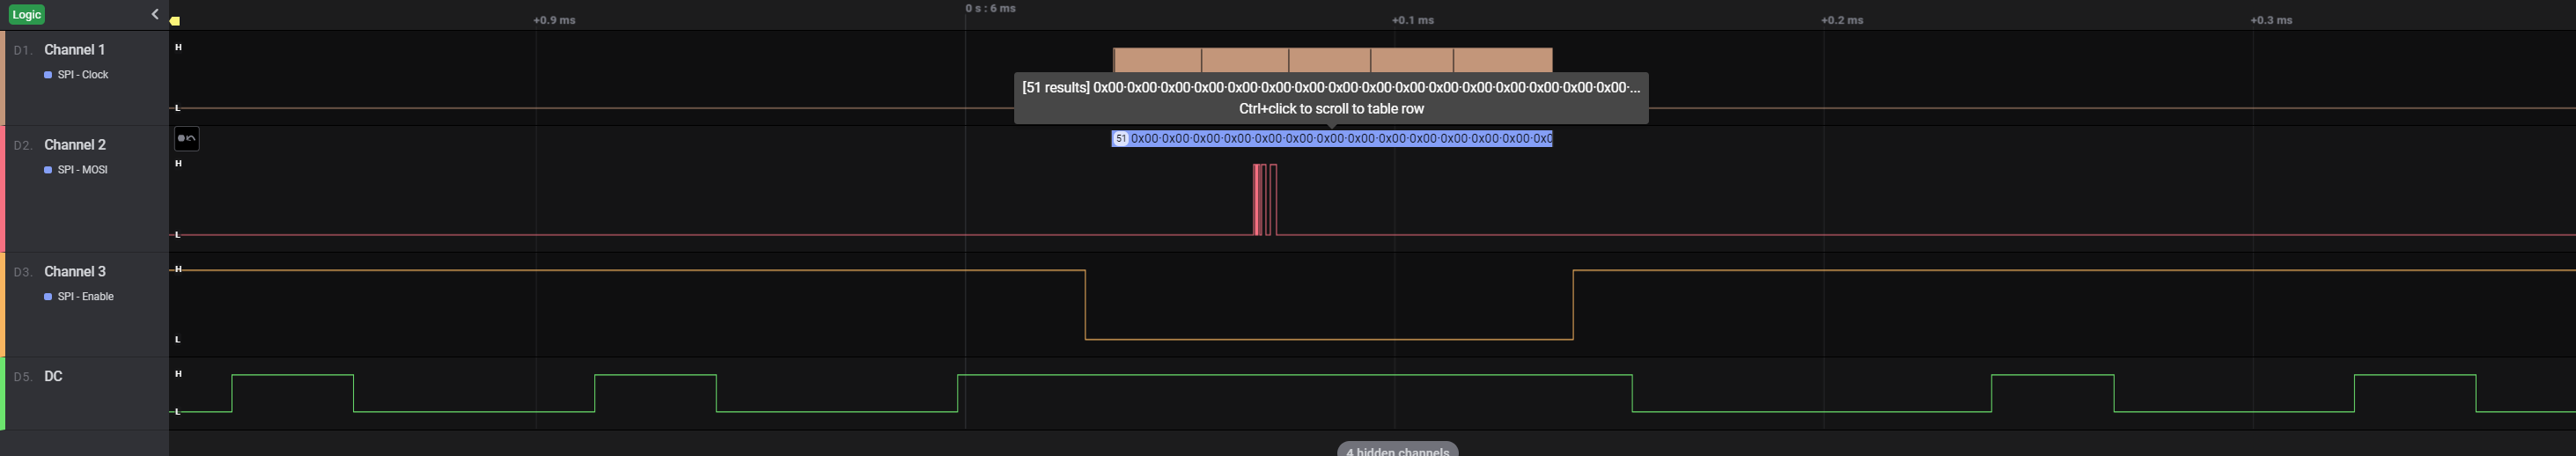
The clock (top line) was on for a long time, but during that time only minimal data was send. Also, we see DC alternations during a time (“left” and “right” from the center) where there was actually nothing being sent. I think you agree this looked very strange. No wonder I got only noise on the display!
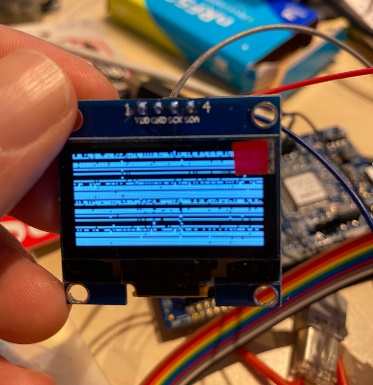
But I think you also get the picture here (pun intended!): Without these insights what was weird, I would have spent a lot of time just trying around with different options and settings until I maybe finally found out by chance what was actually wrong with my code. Seeing here, that at the very least the sending of the DC signal was totally wrong immediately drives you into the correct direction!
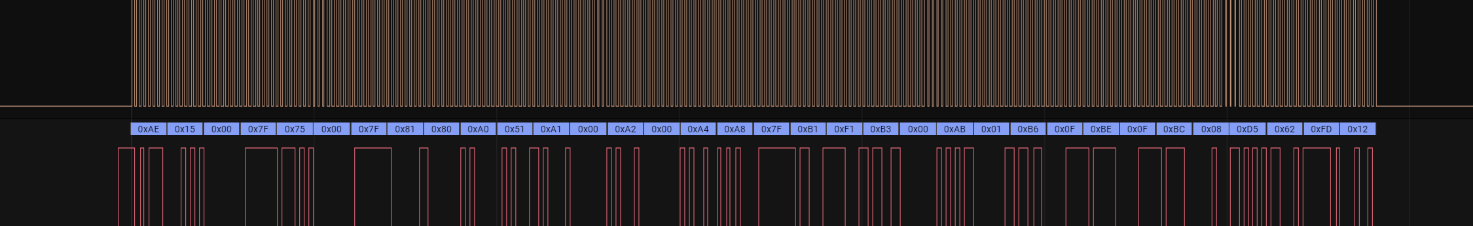
One of the most important features of a Logic Analyzer is of course to not only sample high speed data efficiently and cleanly on many channels but help you with interpreting the data. Humans are not very good at deciphering long sequences of high/low signals and transferring them from binary to something understandable – but software is of course.
So, like other products Saleae’s “Logic” software is also able to interpret the data as TWI, SPI, UART, CAN, … and many, many (!) more protocols so you can actually “see” what values are send and compare them with, for example, the buffers you intended to send in your code. Simple applications “just” decipher the sequence, but the Logic software also let’s you search for certain bytes, let you center/zoom on it, you can save and restore everything to disk, you can even group bursts of data into “transactions” that you can hide or show at once to let you better concentrate on the actual signal to analyze. The cool thing is, that Logic even allows you to write your own plugin that you can use for e.g. your custom signal to analyze or to augment the existing calculations like average frequency, energy in the signal, maximum/minimum level, etc. etc. with additional calculations you need. The possibilities are many-fold and there is already a large number of user-provided plugins available that you can choose from!
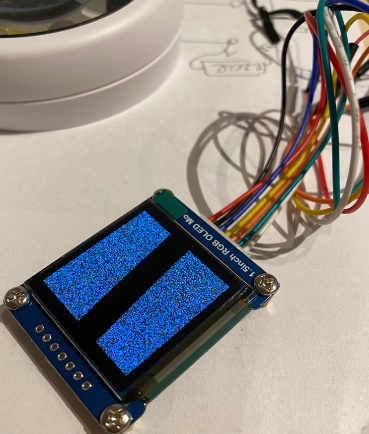
To make a long story short – there were several errors with my code, that I was able to find using the Logic software. The first and biggest mistake was that I was instantiating the completely wrong handler for that display controller. The u8g2 library features a large list of supported controllers with different protocols and accidently I used the TWI variant instead of the SPI variant for the SPI display but of course implemented the handler using the SPI APIs of the nRF SDK for sending out the signals. I had used an old TWI display first (where I had the same problems by the way) and while adapting the handler’s code for SPI I forgot I simply forgot to change the overall driver’s constructor from TWI to SPI as well!
In consequence, from the hardware side everything was OK, but the driver in u8g2 sent totally wrong sequences of bytes which had nothing to do with SPI of course. After this “face palm moment” and switching the driver’s constructor, the signal looked instantly much more like SPI but I still had the DC thing wrong.
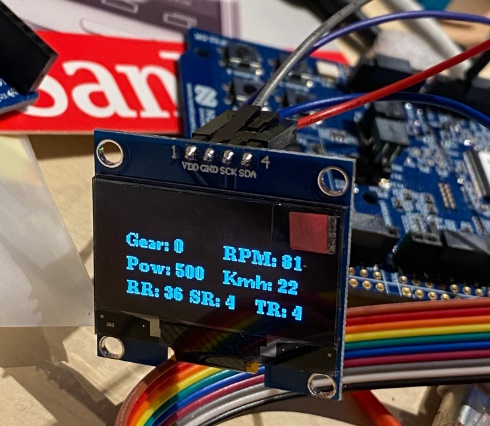
For that it turned out that my code was anticipating that only one data byte is sent at a time. This was the right thing to do in the examples for TWI I first looked at, but for SPI it is self-evident to send multiple bytes at once, and this is also what the library does. But if my handler just ignores those additional bytes and only sends the first one, it is evident the overall sequence looked very wrong.
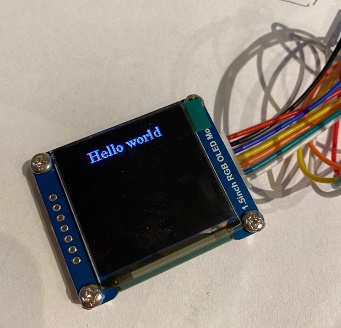
Several facepalms later I managed to get it right and finally saw a nice “Hello world” string displayed on my OLED. From that moment on I could forget about “porting” the library and concentrate on the actual usage of it. I made a quick layout for all relevant data to be displayed and integrated it into my code.
This was an awesome result! Without the Logic Analyzer I do not think I would have found out about my mistakes during the implementation and probably would have given up using that display in the end. I think you agree that such a device is something which can be unbelievably valuable during the development of a complex application! Basically, every time I used the Logic software since then I discover something new. Though you have to spend some money on that product, I honestly think it’s well invested, and you support a company which develops a great product with enthusiasm and dedication! When you are hobbyist or “maker” have a look at the discounts they offer and decide for yourself!
Part 5: What’s left?
Looking back at what I wrote down on the last couple of pages I can now reflect on what’s been achieved and what’s still to be done.
My “proxy” is working quite well, and I have used it for almost two months now in daily workouts and group races. I am really happy with what’s possible with it and what I have achieved. To be honest I did not expect that I would be able to implement such a complex application with so many code parts that I had to code from scratch.
Currently, my focus is more on how to make the whole system a little bit less clunky. Up to now, all the wires are connected to the nRF which resides approximately 1 meter away from the trainer on a small cupboard and is connected via USB as a power source and for logging/debugging to my notebook. Eventually, I would like to mount the whole devices and all the cabling somehow to the home trainer itself. I am thinking about a little “bag” or case that I design and print with my 3D printer that I can fix to the aluminium rods that carry the tablet holder. For that I would also need a mobile power source. At the moment, I am experimenting with putting the whole setup in a small plastic bag that I just hang on a handlebar and power via a USB power bank. This works perfectly! I use a 4000mAh power bar and have used the setup for approx. 6h of workouts so far, and the battery is still more or less fully charged according to the energy level LEDs on the power bank! To be honest I had presumed much more current drain. Of course, the worst case would be an empty battery during a workout, so I am also considering to power the whole system from the home trainer. I have yet to find out how the board computer is powered but I presume it will also be 3.3V or 5V and as far as I saw in the past there are only three cables entering the whole system. Two for the pulse sensors on the handlebars – that I don’t need because I have a heart rate sensor already and one cable called sensor which is connected to the actual home trainer. I presume this cable carries the actual cadence signal and has additional wires for controlling the magnet brake and for powering the board computer. If I find the proper wires I might get the operating power for the nRF board as well. That would be super cool of course as I would no longer need to worry about how to power the board in the end!
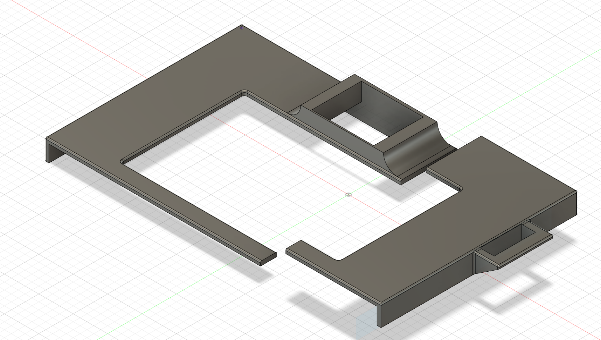
The next thing I want to do is of course properly integrate the OLED display and mount it to the board computer somehow. I already made a couple of sketched with Fusion 360 so it is like a harness that I click on the board computer with a little mount for the OLED display. I am still a beginner with Fusion 360, so even those simple designs are not very easy for me because Fusion is so powerful but also a little bit complex because of this. However, I am getting better at it!
One problem with that design is, that it will be too big to fit on the base of my 3D printer so I will be forced to print it in two parts and then glue it together in the end.
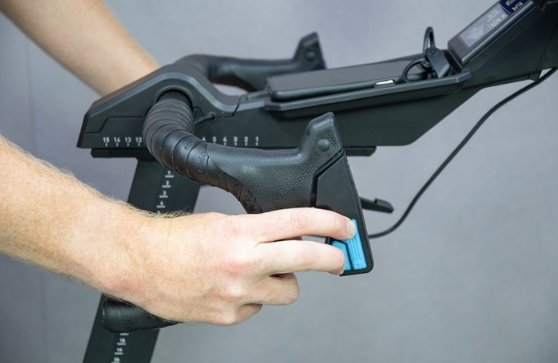
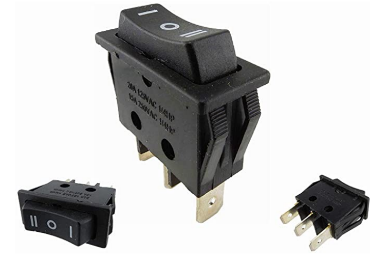
On the right side you see a small holder where I want to put the gear shifter. I decided to move away from two separate buttons for shifting up and down and instead use a SPDT style OFF-ON-OFF rocker switch, so it returns to the neutral position on its own! I bought a couple of models and the one I chose in the end feels nicely, but needs quite some force to press, so I will need a rigid holder for it. Apparently, those switches are designed to be mounted on a metal shield in an industrial control panel or a car’s cockpit. The contacts for the wires are very long and should be used with clamps. Thinking about the options I came up with another idea! The handlebar of my home trainer itself has very little to do with a real handlebar of a racing bike. But why not just replace it with one? You can get cheap handlebars for about 25 EUR and it doesn’t need to be very special or light-weight. On the drops of those handlebars you then attach the bike’s gear shifter and or brakes, so maybe I could do something similar? There are many products on the market which let you ride on a “real” bike that incorporate these joystick-like interfaces. A well-known blogger called DC Rainmaker evaluated a couple of them and I chose the style of the Tacx bike. The following picture shows this design (Picture taken from DC Rainmaker’s webpage https://www.dcrainmaker.com/2019/09/tacx-neo-bike-smart-in-depth-detailed-review.html
- please check it out, it’s a great blog that I got much inspiration from!).
I was researching if there are some kind of ready-made products available for that but couldn’t find any. So I spent some hours watching Youtube videos for Fusion 360 and eventually designed my own. Including plastic clips that hold both halves of the case tightly together!
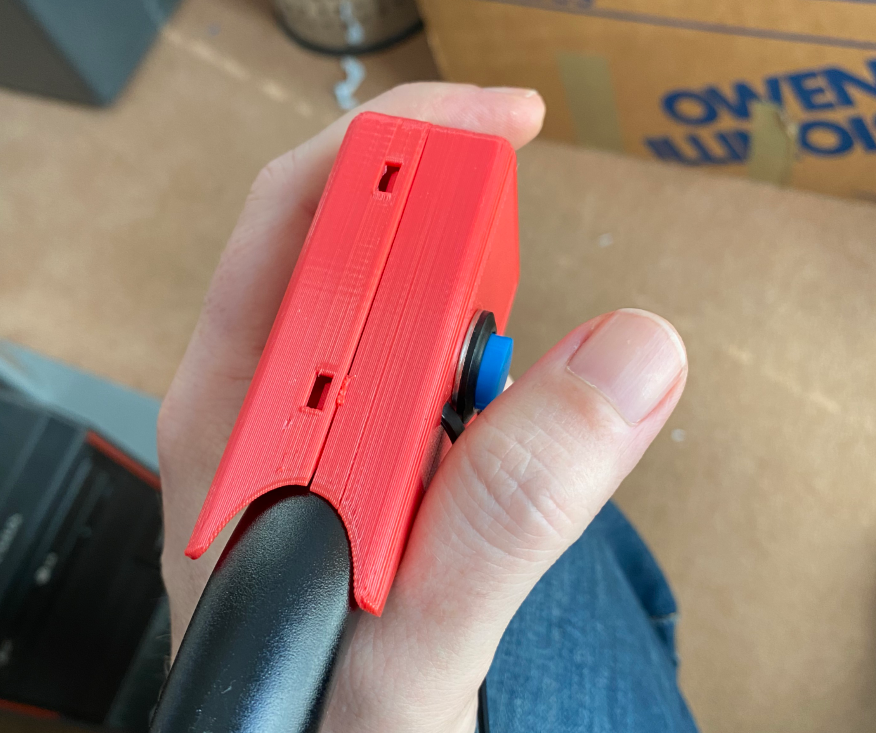
They might not look as cool as the ones designed for these products, but hey! Using that style of shifter immediately opened new possibilities! I could then have not just one shifter but two! One for the cassette at the actual “wheel cog” and one for the front chainring! So instead of 11 gears I could then simulate 3x11 gears! Awesome! Of course I would need 2 more GPIO inputs then for the additional +/- signal I’d take from a 2nd rocker switch. The instantaneous advantage is, as you can see in the pictures, that you press the rocker switch with the help of you index finger instead of pushing it with the thumb if the switch is placed in front of you. This allows for a much more natural feel when riding, similar to pulling a trigger!
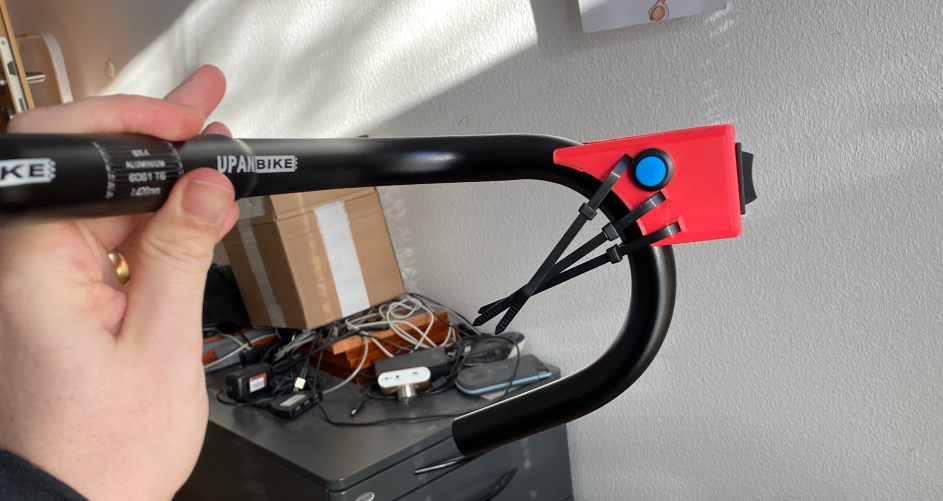
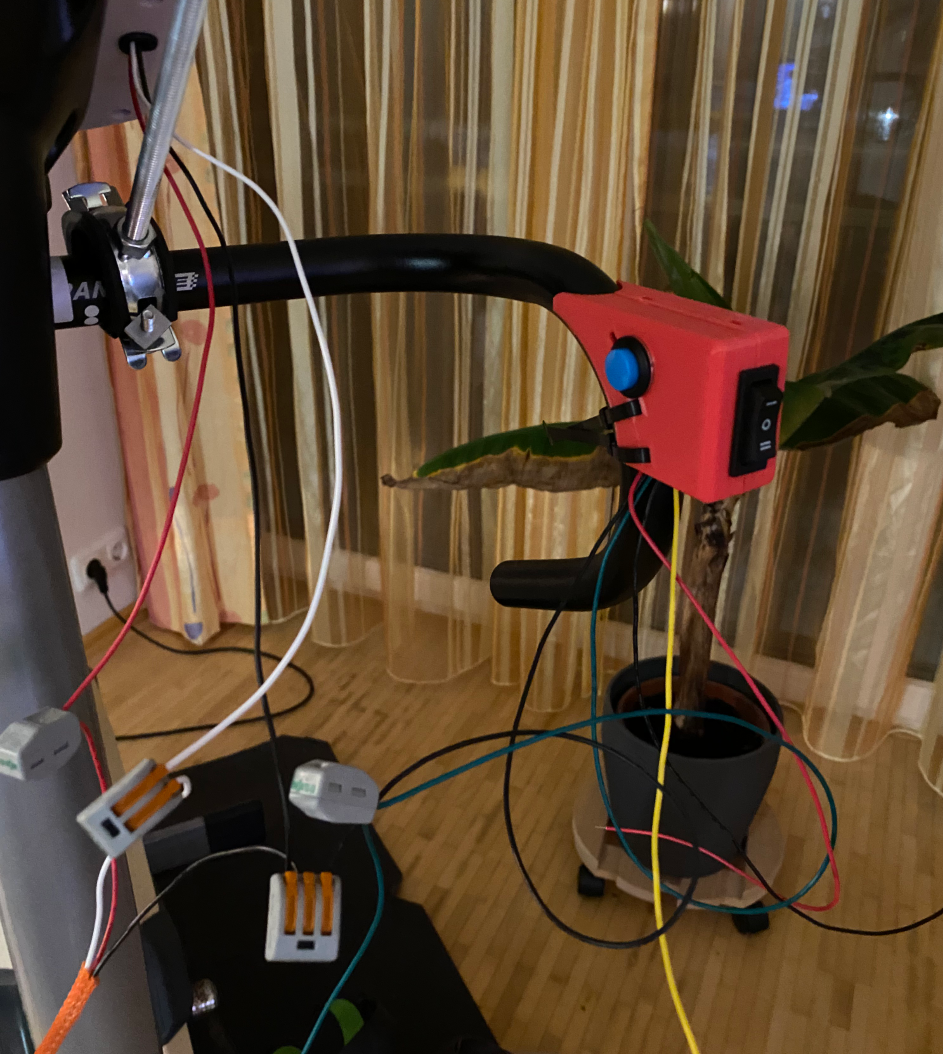
The last weeks Zwift also integrated the steering function of the Wahoo Kickr bike. I didn’t know about that before, but you are able to steer to a certain degree in Zwift as well! Though it appears more or less like an eye candy to me, it can make a difference if you are able to cut corners sharper than your competitors. Well, I don’t do races (yet), but if I am at it – why not integrate something like that as well? Apart from the Kickr bike there are other products available where you rest the front wheel on a plate which then gets turned when you turn the handlebar and sends this to Zwift as well. Luckily others had similar ideas and found out about the protocol and put open source implementations on GitHub to interface this device. I will integrate two buttons “Left”, “Right” on my two handlebar drops (the blue ones) which act similar to this device as I don’t have a real front wheel I could turn. This means again two more GPIOs to be used… oO I am running out of free GPIOs soon :-D Of course the handlebar will be wrapped with tape beforehand, the picture just shows some “proof of concept” implementation. For drilling the holes into the handlebar I bought a metal drill set that I can use with my box column drill. I assume a 13mm hole should allow for all the cables to comfortably fit through it. In the middle of the handlebar near the center rod of the home trainer I’ll drill another hole for them to exit and to be connected to the home trainer.
As you can see I am active on a couple of areas at the same time but everything is progressing quite nicely. Now that I can do my daily workouts with Zwift I am no longer in a hurry and can continue on the project whenever I have time – which is unfortunately very little since the X-mas holidays ☹
The last big field I am working on promises to be one of the most complex ones as well. I intend to add full ANT FE-C capability using the proprietary “ANT over BLE” protocol of a popular vendor of Smart trainers. This vendor also has his own app where you can ride to real first-person view videos along famous routes in Europe but the problem is, that this app exclusively uses this custom Bluetooth service for talking to the smart trainer and is neither using CSCS, CPS nor FTMS. I already found out a lot about the inner workings and even managed to have my proxy be recognized as one of the official products of that vendor but now I have to implement FE-C… 😉.
Thanks to some Bluetooth tool logs I received from friends that own such a trainer I was able to write a small parser in Python to decode the various messages for me and make the overall picture somewhat clearer to me.
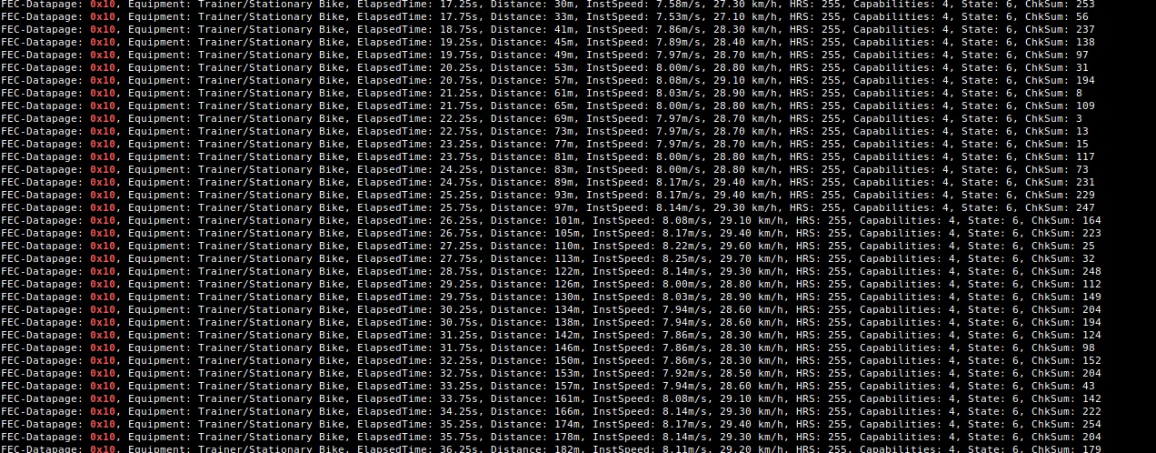
The added benefit is that I should be able to use this FE-C then also from within Zwift which would give me an even more accurate simulation than I have today. As mentioned earlier on during the description of the simulation parameters of FTMS and the corresponding FE-C parts, there is this aspect of drafting where the wind resistance is less if you’re directly behind another rider because they shield you from the head-wind. For some reason it seems FTMS does not allow that parameter to be send through the “indoor simulation parameters” characteristic. You can specify the wind speed there and the cw coefficient though which in combination, I presume, could be used for modeling this. FE-C has a dedicated value just for drafting and most of the apps jumped on the train to support FE-C so I presume that’s the main reason why FTMS is still not supported as well as FE-C from what I see. There is also a nice blog article about FE-C on DC Rainmaker’s page I mentioned earlier, so go check it out if you want to know more!
The really very last idea for the moment that I’d like to integrate is a Bluetooth controlled head wind unit aka a normal fan which can be controlled using Bluetooth. Most desktop fans have 1 to 4 different speed settings which can be selected using a physical switch and it is of course to switch those using a relay controlled from a microcontroller!
There are a couple of projects (e.g. https://www.youtube.com/watch?v=6tJlJQgutkI) which do exactly that already, that I could build on. The only problem is, that those projects involve 220V and I have next to no experience with these voltages and high respect (which is said to be a healthy thing ) Let’s see how this idea evolves. Having a speed or heart rate controlled head wind while riding would be cool indeed. On a steep hill you really experience what it means for your body to climb that incline!
So, as said, that’s it for the moment. The next mods will be the FE-C, OLED display and handlebar thing and I intend to continue this report once I can say more about it.
I hope you liked what you read and it was maybe motivating and inspiring to you to try something like that for yourself. With this project it was again evident that once you have a real goal in front of you that you want to achieve, it is much easier to actually create something cool as if you’re just playing around without a clear idea of what it will be in the end.
During that project I learnt a lot about C, about source control using git, electronic basics of a “freshmen” level and about the whole Bluetooth standard and the Nordic SDK.
That result would not have been possible without the great online support from Nordic, which was really helpful in solving some challenges I had during development, the online community and many GitHub projects that already paved the path I was wandering along.
- Picture taken from https://embeddedthoughts.com/2016/06/10/attiny85-debounce-your-pushbuttons/